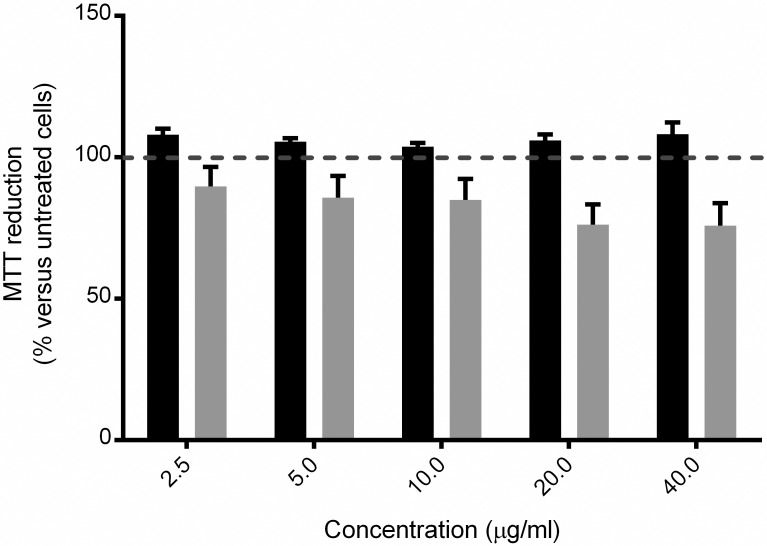
Fig 5. MTT reduction assay.
A549 (black bars) and RH (gray bars) cells were treated for 24 h with the indicated concentrations of E. granulosus AgB. Cell viability is expressed as percentage of MTT reduction measured for untreated cells and assumed as 100% (horizontal dashed line). Error bars correspond to the SEM values of five independent experiments.

