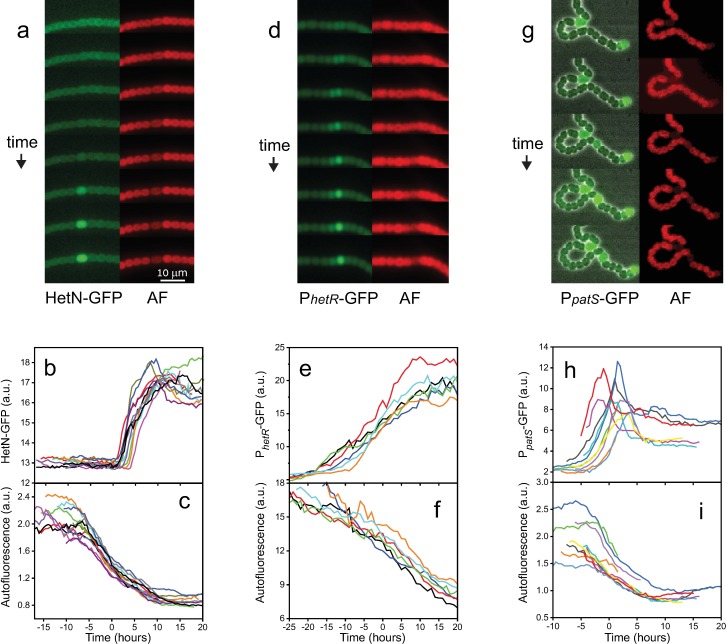
Fig 2. PatS and HetN have different spatiotemporal roles during pattern maintenance.
Filaments under nitrogen deprivation conditions on a gel pad were followed over time as they developed (see Methods). (a) Expression of HetN-GFP during the formation of an intercalary heterocyst (left panels) and decline in AF from photosynthetic pigments (right panels). The interval between adjacent snapshots is 90 min. (b,c) Traces of fluorescence and AF from events as in (a). (d) Snapshots of PhetR-GFP expression (left panels) and AF (right panels) in the central portion of a vegetative interval between two heterocysts. The interval between adjacent snapshots is 90 min. (e,f) Traces of fluorescence and AF as a function of time from events as in (d). (g) Expression from PpatS-gfp overlaid on phase contrast images (left panels) and decline in photosynthetic AF (right panels) during the formation of an intercalary heterocyst. The interval between these snapshots is 2.5 h. (h,i) Traces of fluorescence and AF from events as in (g). The scale bar in (a) is the same for (d) and (g). The traces in (b,c), (e,f), and (h,i) have been displaced along the temporal axis so that the time corresponding to half the AF decay in all cells (defining t = 0) coincides. The data used in this figure are included in S1 Data. AF, autofluorescence.

