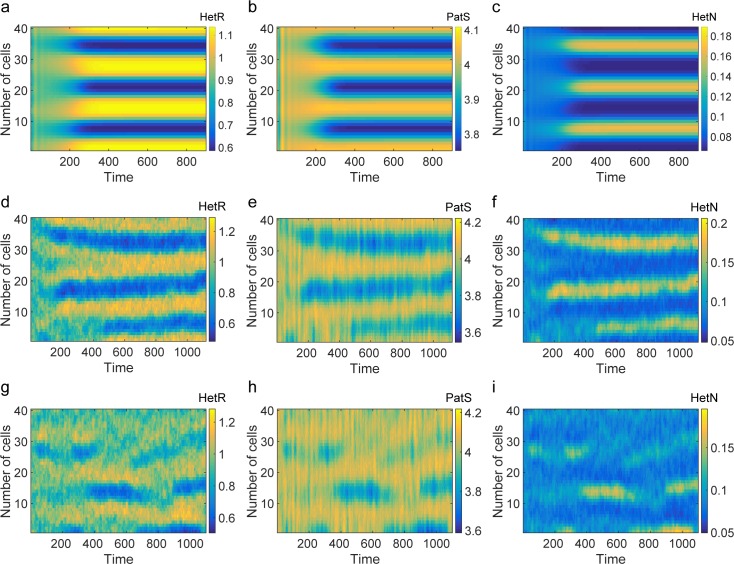
Fig 4. Turing patterns inside and outside the instability region.
(a–c) Numerical integration of Eq (9). (d–f) Stochastic simulations using the Gillespie algorithm. Parameters correspond to those used to compute the red stars curve of Fig 3A and apply to all panels from (a) to (f). (g–i) Stochastic Turing patterns corresponding to the blue diamonds curve of Fig 3A. For all panels, Ω = 40 and V = 5000.

