
Fig 6. Region of stochastic versus deterministic Turing instability.
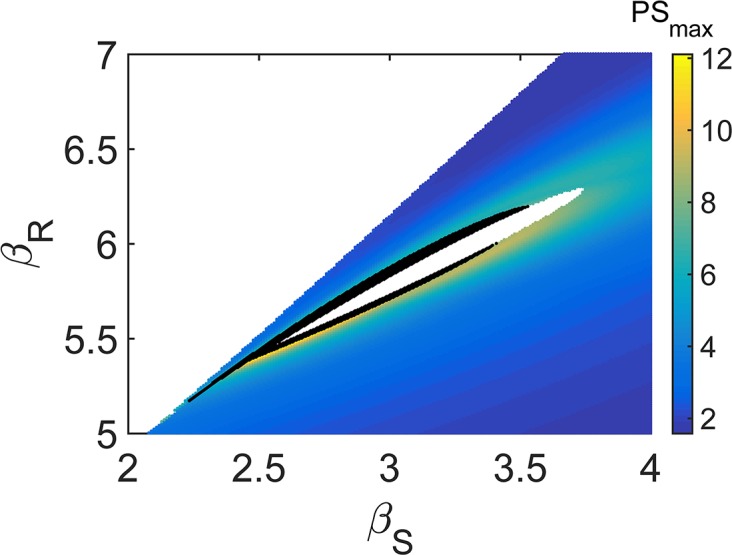
Region in the plane (βS,βR) where the power spectrum of HetR fluctuations displays a localized maximum. The color code reflects the height of the peak. The domain filled in black denotes the deterministic instability region (see S2B Fig) Parameters are set as kR = 0.2, αR = 0.2, K = 2, kS = 0.1, αS = 0.1, μS = 0.1, kN = 0.7, αN = 0.3, μN = 3, DS = 4, DN = 4, and Ω = 40.