
Figure 1. eLORETA estimated normalized alpha current density across the brain.
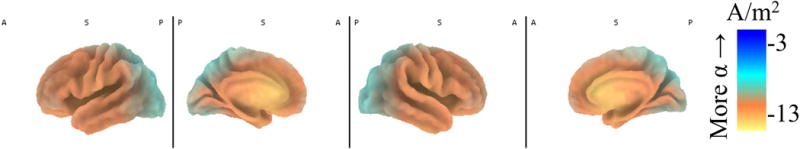
Intracranial eLORETA alpha (8Hz-13Hz) current density across the brain. Current density was normalized (current density for a voxel divided by the summed current density across all voxels) and then log-transformed. Cooler colors (i.e., blue) indicate more alpha power and less activity. Hotter colors (orange and yellow) indicate less alpha power and more activity. Parietal-occipital regions showed the greatest alpha power. Anterior medial regions were characterized by less alpha power and more activity at rest.