
Figure 7. Overlap between voxels associated with scalp-level asymmetry scores and voxels associated with lifetime MDD.
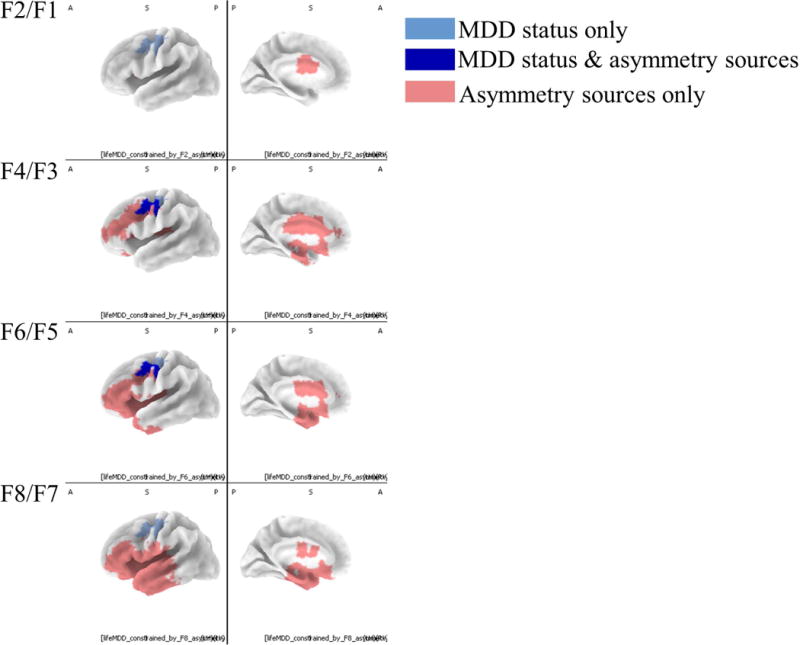
Intracranial asymmetry scores for MDD groups and healthy controls presented along with regions identified as predictive of surface asymmetry. Light blue voxels indicate regions where MDD groups had smaller intracranial asymmetry scores (less relative left activity) than healthy controls. Red voxels indicate regions that correlated (r greater than ±.3) with surface asymmetry scores. Dark blue voxels were related to both surface asymmetry and lifetime depression history. Only the left hemisphere is displayed because these were intracranial asymmetry scores, and thus there is only one value for each pair of homologous left and right voxels.