
Fig. 3. Iron uptake from siderophores and from ferric EDTA is not regulated in the same way.
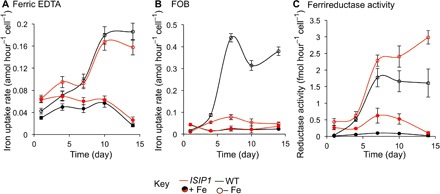
The figure shows rates of iron uptake from ferric EDTA (A) and FOB (B) as well as ferrireductase activity (C) as a function of time in wild-type (black) and ISIP1 knockdown cell lines (red) grown in iron-rich (closed symbols) or iron-deficient medium (open symbols). The cells were grown for 1 week in iron-rich medium (1 μM ferric citrate in Mf medium), washed twice with iron-free Mf medium, and re-inoculated at 2 × 10⁶ cells/ml in iron-free (open symbols) or iron-rich medium (1 μM ferric citrate; closed symbols). The cultures were diluted every 2 days with the same media to maintain cell density at 2 × 10⁶ cells/ml for 2 weeks. For ferrireductase activity, initial rates of uptake (first 30 min of kinetics) are plotted against the day since the start of the experiment. Data are means ± SD from four experiments (two biological replicates with two technical replicates). ISIP1 knockdown cell lines show a marked descrease in Fe uptake from FOB, but not from ferric EDTA, and a higher ferrireductase activity than wild-type cells. Maximal induction of FOB uptake activity under iron-deficient condition occurred before maximal induction of ferric EDTA uptake activity.