
Figure 5. Morphology and drug distribution of representative untreated arterial segments.
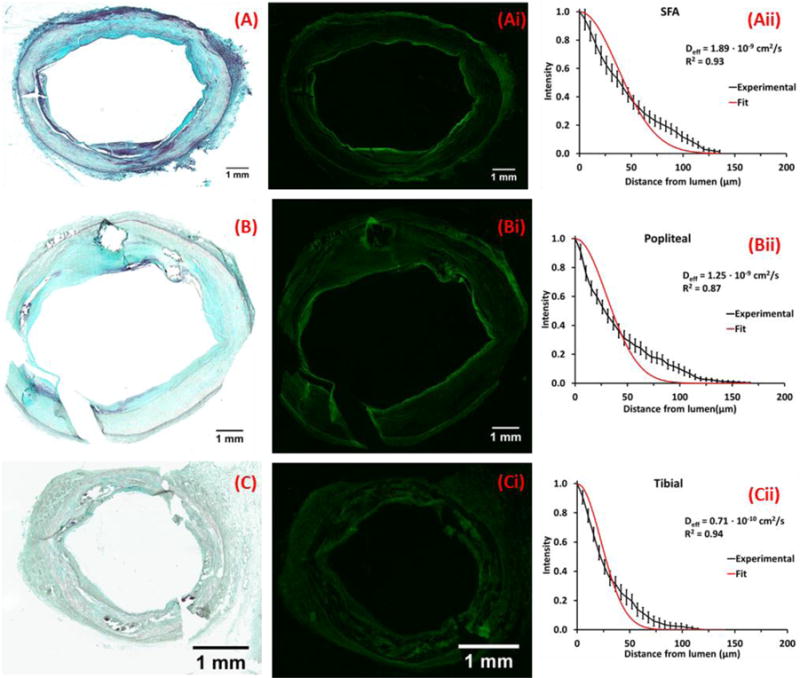
Representative MP stained frozen sections of the SFA (A) popliteal (B) and tibial (C) arteries from a single leg; neointima thicknesses are respectively 372±166μm (A), 737±704μm (B) and 111±44μm (C). Corresponding fluorescent micrographs (Ai, Bi, Ci) and normalized circumferentially averaged intensity plots (Aii, Bii, Cii) are depicted (black lines) to the right of each micrograph along with best fit diffusion-binding predictions (red line, Eq. 3). Best-fit effective diffusivities are respectively 1.90×10⁻⁹ cm2/sec (A), 1.25×10⁻⁹ cm2/sec (B) and 0.71×10⁻⁹ cm2/sec (C).