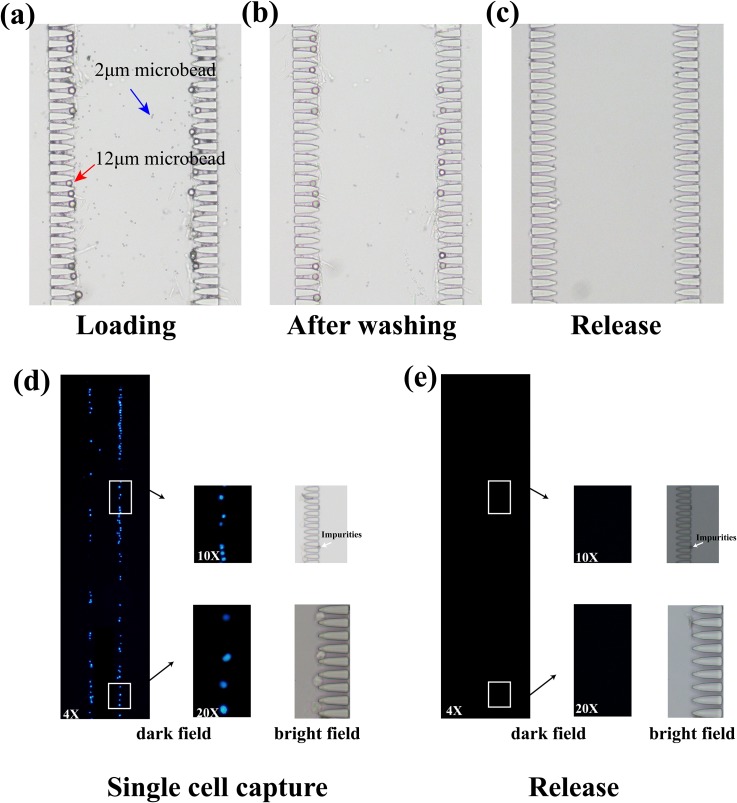
FIG. 2.
(a)–(c) The isolation and release of microbeads using the trap structures. The red arrow presented that the 12 μm microbead was trapped and the blue arrow presented that the 2 μm microbead was separated. (d) and (e) The capture and release of Caco-2 cells using the trap structures. Caco-2 cells stained by DAPI off the chip were used to evaluate the performance. A full view of fluorescent images under the objective magnification of 4× was shown. The images under the objective magnification of 10× and 20× were also presented to show the details inside the white boxes. The white arrows represented the unstained impurities.

