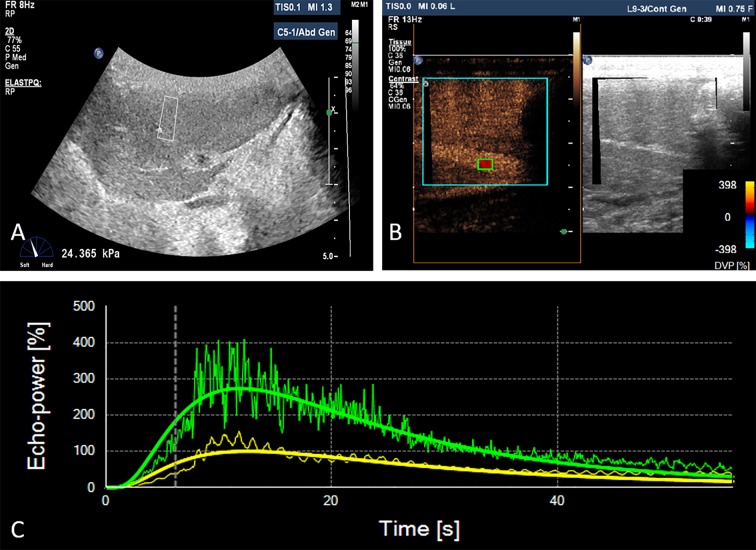
Fig. 1.
A. In vivo stiffness measurement of the rabbit liver on the subcostal scan plane over B-mode ultrasound images. The white boxes represent ROI (region of interest) for stiffness measurement. B. A snapshot of the video clip of a contrast-enhanced ultrasound examination at 39 seconds after the injection of Sonovue. The sonogram on the right side is a grey-scale ultrasound, and the sonogram on the left side is in contrast mode. On the contrast mode image, the turquoise ROI included the right liver lobe on the subcostal scan plane, the green ROI was put on the portal vein. Motion compensation was applied automatically. C. Time-intensity curve (TIC) of portal vein (green line) and right liver lobe (yellow line).

