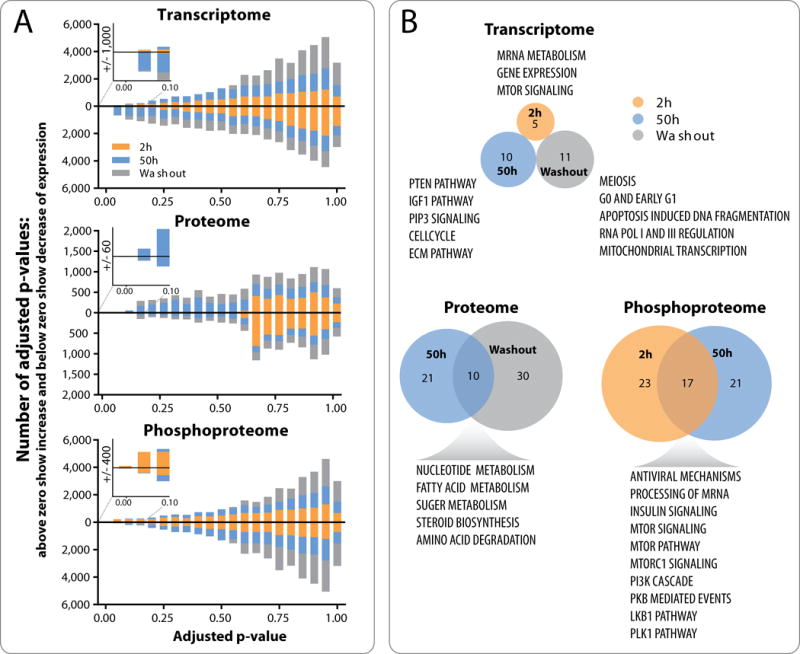
Figure 3. Pharmacodynamic changes after buparlisib treatment show essential differences between the transcriptome, proteome and phosphoproteome.

A, one-sample moderated t-tests identify markers that have an average difference from zero across all tumors. Lake plot graphs show stacked histograms of Benjamini-Hochberg adjusted p-values when analyzing samples collected at 2 hours, 50 hours and washout separately. Bars above zero represent markers with increased expression, while bars below zero represent markers with decreased expression. Inserted zooms show number of markers with an adjusted p-value ≤ 0.1 for each platform. B, Pathway enrichment analyses were performed using the GeNets networking tool against the Molecular Signatures Database (C2:CP). Venn diagrams show overlap of significantly enriched pathways (Bonferroni adjusted p-value ≤ 0.05) that are summarized in the text. No significant markers were identified in proteome space for 2 hours buparlisib treatment or in phosphoproteome space for washout treatment and these are therefore not included in the pathway enrichment measurements.
