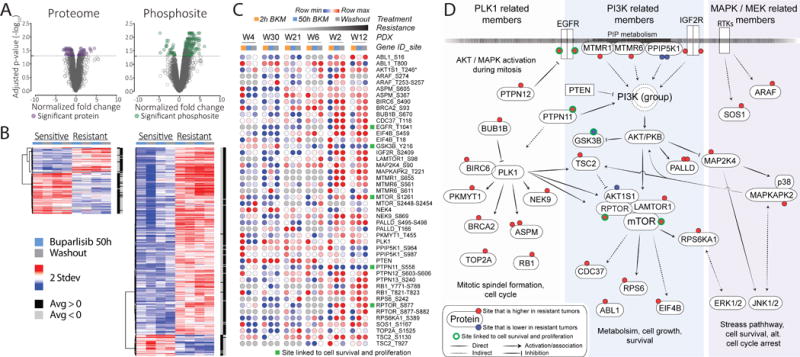
Figure 4. Many differentially expressed markers are involved in PI3K signaling.

A, volcano plots of proteins and phosphosites, in which fold changes are plotted versus the -log10 of their adjusted p-values. Fold changes are based on a two sample moderated t-test identifying response markers between the two most sensitive and the two most resistant tumors and p-values are adjusted using the Benjamini-Hochberg approach. Fifty hours buparlisib and washout treatments were used as replicates. B, heatmaps respectively represent significantly differentiated proteins and phosphosites (adjusted p-value ≤ 0.05). C, significant response markers that are differentially expressed relative to vehicle treatments between the two most resistant and the two most sensitive PDX tumors are plotted for all PDX tumors. Green squares indicate phosphosites linked to cell survival and proliferation. D, a schematic network that puts the significant markers in panel C into the context of their signaling. These markers highlight the PLK1, PI3K and MAPK/MEK pathways (shaded colors). Rectangular gene boxes indicate significant changes on protein level, as opposed to regulated phosphosites (red and blue circles).
