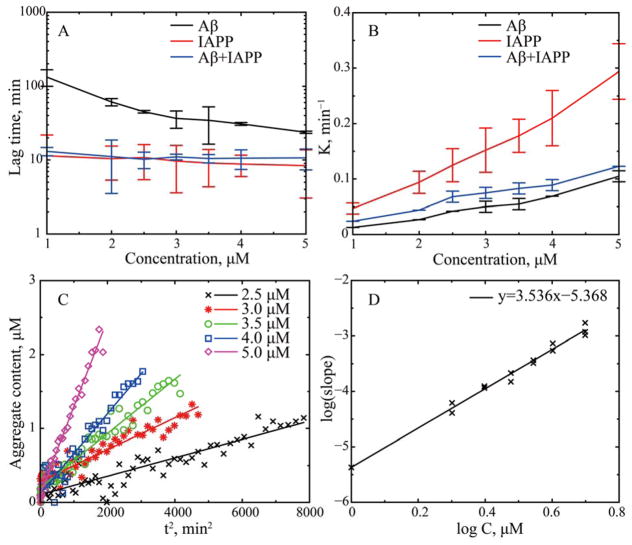
Figure 1.
In vitro studies of Aβ-IAPP cross- and self-association. Seven different concentrations from 1 to 5 μM were studied with each kinetic measurement performed at least in triplicate. The concentration dependence of (A) the aggregation lag time and (B) fibril elongation rate for Aβ-IAPP co-aggregation (blue), and the self-aggregation of Aβ (black) and IAPP (red). (C) For the aggregation of Aβ, the amount of aggregates during the initial phase of aggregation linearly depends on the square of time, t2. (D) The log-log plot of the slops in panel C vs. the peptide concentrations shows the power-law dependence. The linear fit in the log-log plot results into an exponent index of ~3.54s.

