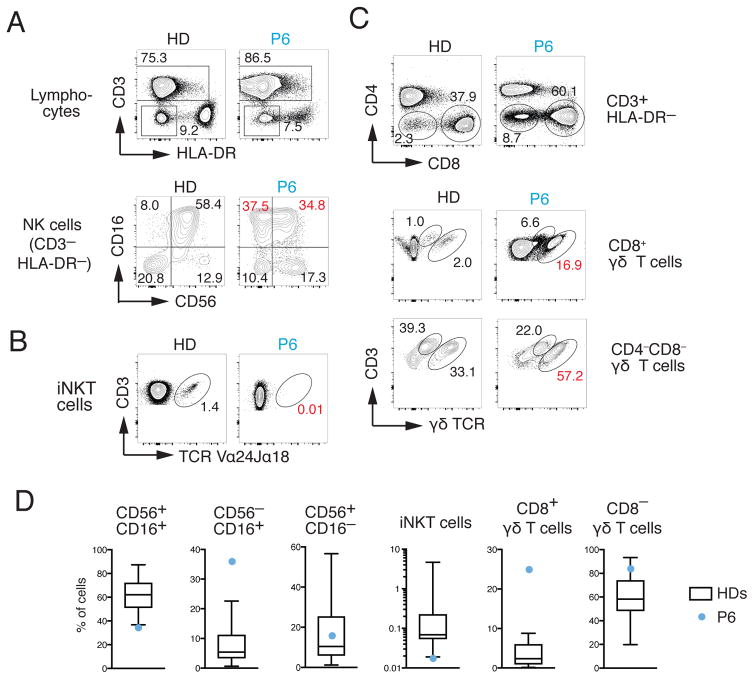
Figure 5. Lack of iNKT cells and perturbed NK and γδ T cell populations in ORAI1 deficient patient.
A–C, Flow cytometry analysis of PBMCs from the 20-year-old P6 and a representative HD control for NK cells (A), iNKT cells (B) and γδ T cells (C). A, For the detection of NK cells, CD3− HLA-DR− lymphocytes were stained with antibodies against CD16 and CD56. B, For the detection of iNKT cells, lymphocytes were stained with antibodies against CD3 and the Vα24Jα18 TCR. C, For the detection of CD4−CD8+ and CD4−CD8− γδ T cells, lymphocytes were stained with antibodies against CD3 and the γδ TCR. Numbers in red in panels A–C indicate marked differences in T cell subsets in P6 compared to HD controls. D, Frequencies of CD16+CD56+, CD16−CD56+ and CD16+CD56− NK cells, CD3+ Vα24Jα18+ iNKT cells and CD4−CD8+ or CD4−CD8− γδ T cells in PBMC of P6 (blue circles) from panels A–C compared to 23 unrelated HD controls (aged 22–65 years). Whisker plots show the median, 25–75 percentiles and minimum and maximum values of the distribution of HDs.

