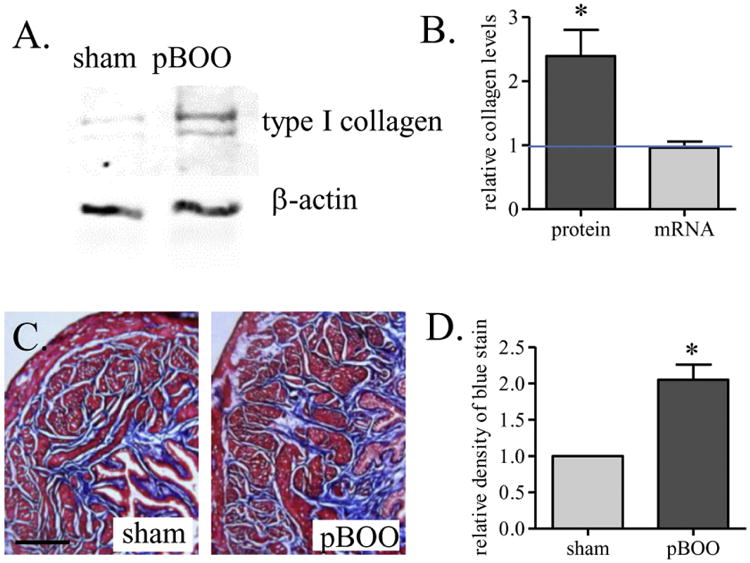
Figure 2. Up-regulation of type I collagen in the hypertrophic urinary bladder.

Western blot (A) analysis shows an increase in the protein expression level of type I collagen (B, protein). Real-time PCR analysis shows that the mRNA level of type I collagen is not changed by 2 weeks of pBOO (B, mRNA). Trichrome stain analysis of the blue stain shows increases in fibrosis in the hypertrophic urinary bladder (C-D). *, p<0.05 vs. sham control. Bar = 200 μm.
