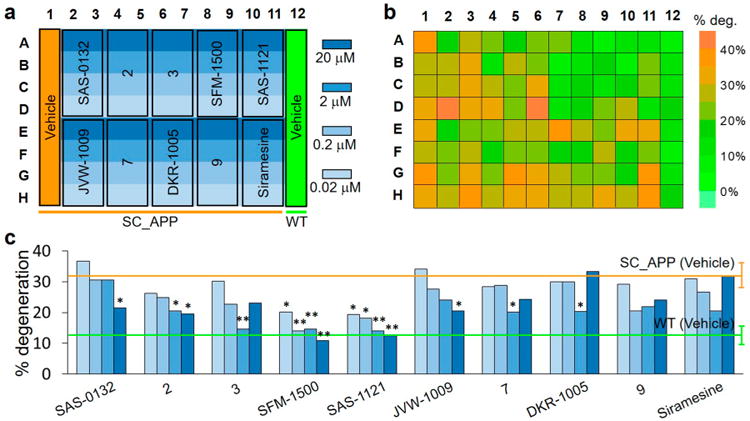
Figure 6.

Drug screening of novel compounds using the 96-well microfluidic chip on C. elegans SC_APP model. (a) Loading map of the chip with WT and SC_APP model animals with vehicle control (200 μM FUdR and 0.5% DMSO) and four doses (0.02, 0.2, 2, and 20 μM) for 10 different compounds. (b) Color map of average degeneration percentages of each individual well loaded with drug-treated D3 animals. (c) Dose-dependent neuronal degeneration percentages of treated animals. Green and orange lines represent the degeneration percentage (mean ± SD) of WT and SC_APP animals treated with vehicle only. The statistics were calculated using Fisher's exact test as compared to SC_APP animals treated with vehicle only; P < 0.001 (**) and 0.001 < P < 0.05 (*); drug dose is indicated by the different shades of blue in panel (a).
