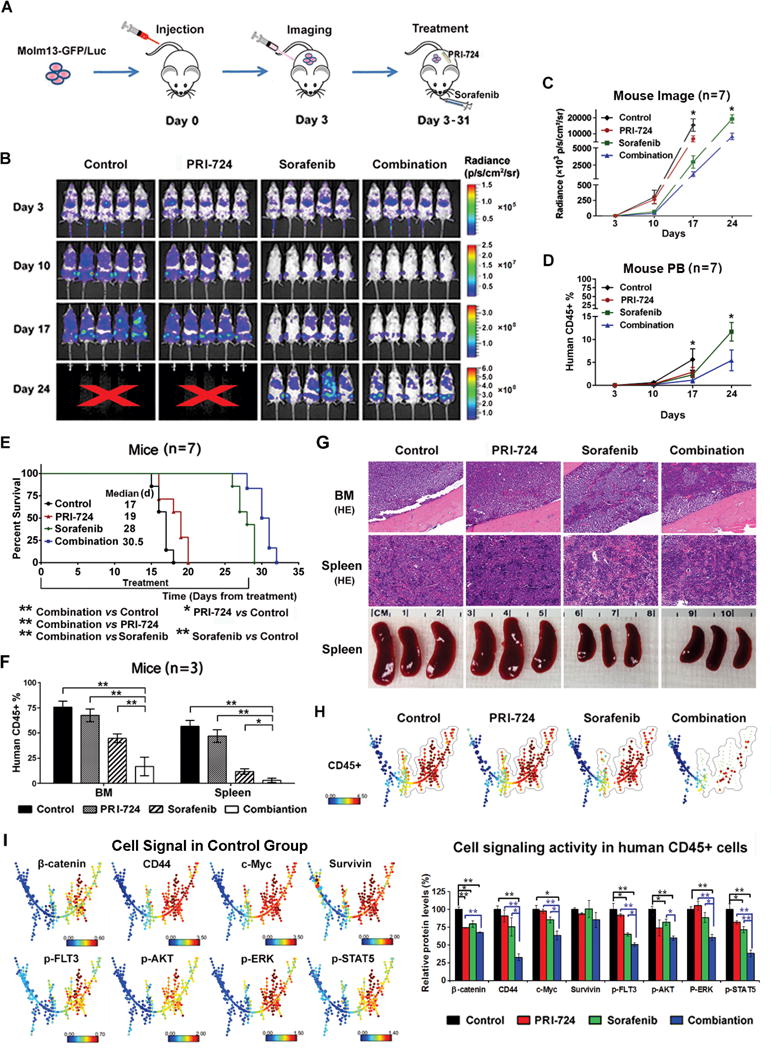
Fig. 4.

PRI-724 enhances sorafenib activity in Molm13-GFP/Luc xenograft NSG mice. (A) Experimental scheme. After confirmed engraftment of Molm13-GFP/Luc cells by imaging, mice were treated with RPI-724, sorafenib, or the combination for 4 wk. (B) Weekly images of mice using the IVIS-200 imaging system. X, no alive mice. (C) Imaging quantification by the IVIS-200 software. (D) Leukemia cells (human CD45+) in mouse PB determined by flow cytometry. (E) Survival curves. (F) Leukemia cells (human CD45+) in mouse BM and spleen detected by flow cytometry. (G) Mouse BM and spleen H&E (HE) staining (200×) and spleen sizes. (H) CyTOF/SPADE analysis of leukemia cells (human CD45+) in mouse BM samples after 15 d-treatments. (I) The expression of β-catenin targets and FLT3 downstream signal proteins in human CD45+ cells in BM of control mice presented in SPADE tree (left panel) and the quantitation of these proteins in various treatment groups (right panel). *, P<0.05; **, P<0.01.
