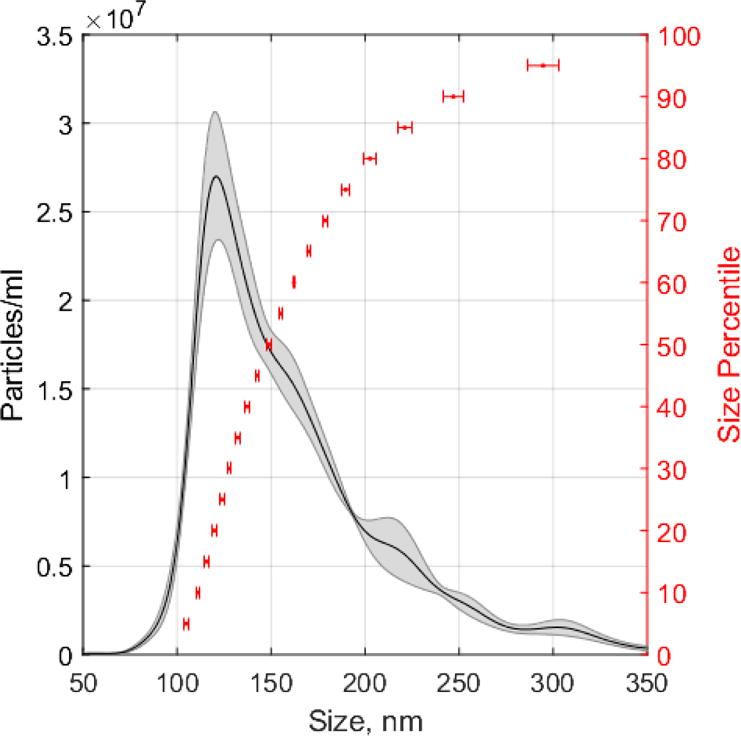
Figure 2. Mouse liver lipid droplet size distribution determined by NTA.

The particle concentration was (2.13 ± 0.14) × 109 particles/mL (mean ± SEM, n=5 technical replicates). Shaded area of histogram represents particle density (average ± SEM, n=5 technical replicates). Horizontal error bars represent size error (± SEM, n=5 technical replicates) at percentiles ranging from 5th to 95th percentile at 5% increments.
