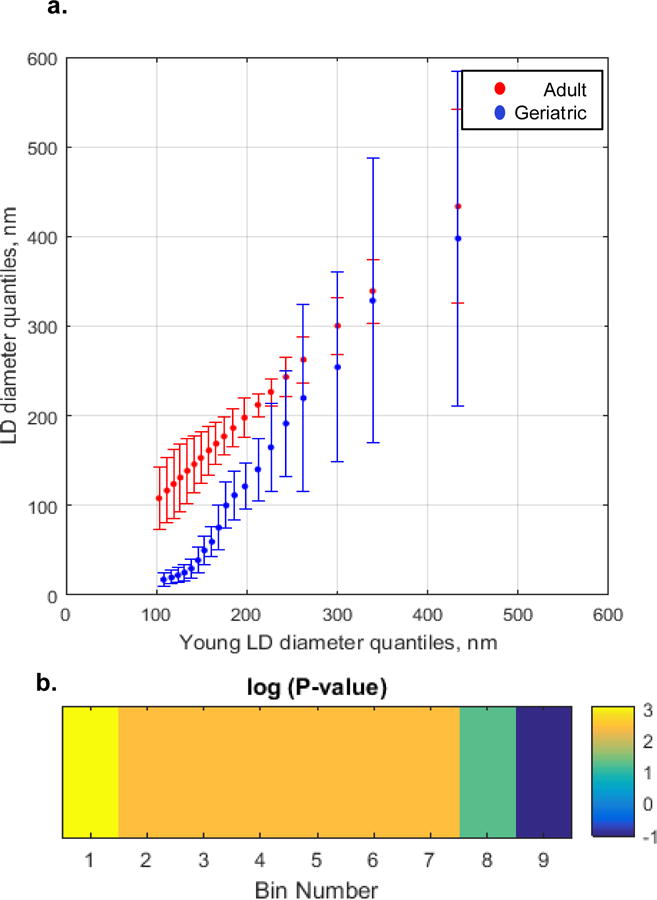
Figure 4. Comparison of the lipid droplet size distributions of adult and geriatric mice.

(a) QQ plot. LD diameter (nm) geriatric (y axis, blue) and adult (y axis, red) vs adult (x-axis). Geriatric and adult mice were ~ 115 and ~ 35 weeks old, respectively. Markers represent percentiles ranging from 5th to 95th percentile at 5% increments. Each percentile is represented as average ± SEM, n = 3 mice. (b) Significance plot from hypothesis testing of average adult and average geriatric LD size distributions. Color coded areas of significance are shown in the QQ lot, Part (a). A Wilcoxan Rank Sum test compared the percentiles of each distribution (for each 10% of the data set, Bins 1-9) from 1% to 99%. Each p-value was transformed by calculating −1.3-log10(P-value). This was done for ease of visualization, such that all P-values <0.05 are transformed as above 0 and all P-values that are >0.05 are transformed as below zero[47].
