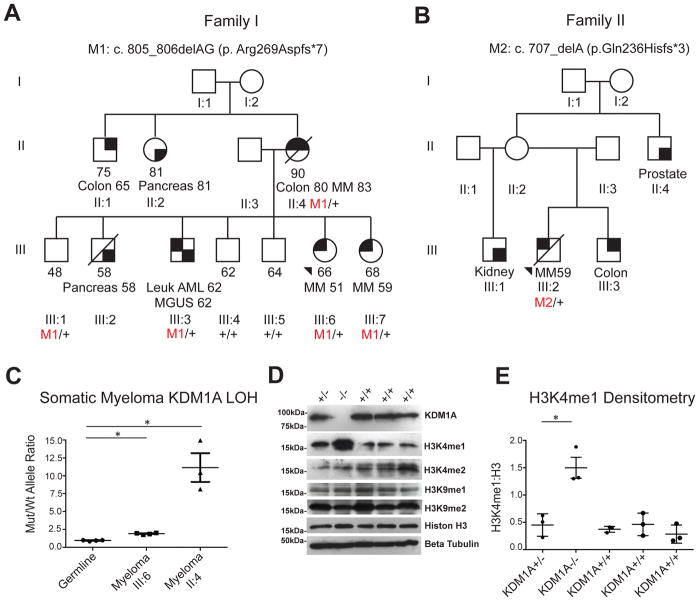
Figure 1. Identification of germline KDM1A mutations in familial and early onset multiple myeloma patients.
A. Pedigree of familial myeloma kindred carrying germline KDM1A c.805_806delAG (p.Arg269Aspfs*7) mutation.
B. Pedigree of early onset myeloma proband carrying KDM1A c.707delA (p.Gln236Hisfs*3) mutation. Last known ages, age of death if applicable, affected status with different malignancies, and ages at diagnosis are indicated. MM, multiple myeloma. AML, acute myeloid leukemia. MGUS, monoclonal gammopathy of uncertain significance. Colon, colon cancer. Pancreas, pancreatic cancer. Prostate, prostate cancer. +, wild-type. M1 and M2, mutations. For kindred shown in B, only the proband had a biospecimen available for testing. For this kindred, ages of diagnosis for colon, kidney and prostate cancers in family members could not be rigorously confirmed and so are not included. C. Somatic loss of heterozygosity (LOH) in germline and myeloma cells from probands III:6 and II:4 in family carrying KDM1A c.805_806delAG (p.Arg269Aspfs*7) using digital droplet PCR (ddPCR). Ratio of KDM1A c.805_806delAG (p.Arg269Aspfs*7) mutant:wild-type allele for germline and myeloma cells are indicated with mean. * P< 0.01 by Mann-Whitney test, LOH, loss of heterozygosity. N=3 and 4 respectively. Mean and s.e.m. are shown. D, E. Western and densitometry analysis showing KDM1A null (−/−) LCLs (generated from family member III:6 from the kindred shown in Figure 1A) have undetectable KDM1A and increased H3K4 mono-methylation (H3K4me1):H3 ratio. H3 di-methylated isoform (H3K4me2), H3 and tubulin are shown for comparison. Heterozygote and compound heterozygote LCLs were made from Family 1 III:6 (lanes 1 and 2) and wild type LCLs were made from Family 1 II:3, III:4 and III:5 (lanes 3–5). Densitometry represents 3 independent measurements from each of the LCL cell lines. Mean and s.e.m. are shown. * P= 0.015 by two-tailed student t test. LCL, B lymphoblastoid cell line.

