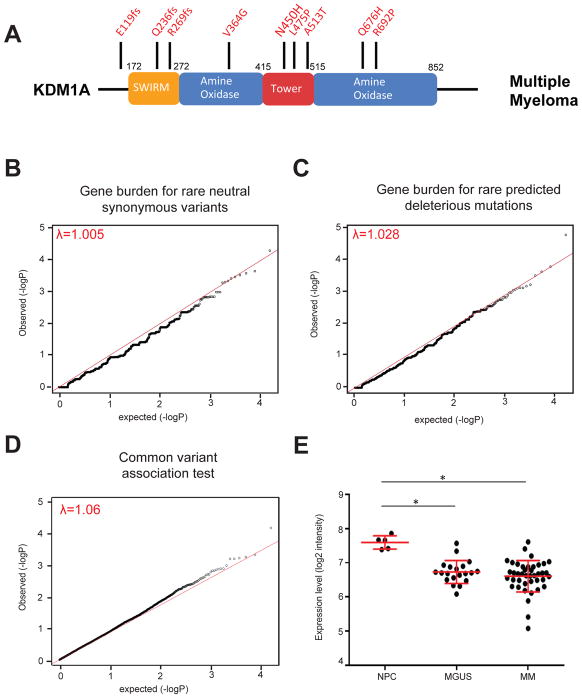
Figure 2. KDM1A germline mutations in multiple myeloma patients.
A. Schematic of KDM1A protein. Germline mutations from Multiple Myeloma patients are shown on top. B–C. Quantile-quantile plots of gene-based burden tests for rare neutral synonymous variants (B) and rare predicted deleterious mutations (C). D. Quantile-quantile plot of MM case and control common variants. Lambda statistics are shown. E. KDM1A mRNA levels in normal plasma cells (NPC), MGUS and MM cells. *, p=7.45 × 10⁻⁶ (NPC-MGUS) and 1.70 × 10⁻⁵ (NPC-MM) respectively, moderated t-test. Mean and SEM bars are indicated.

