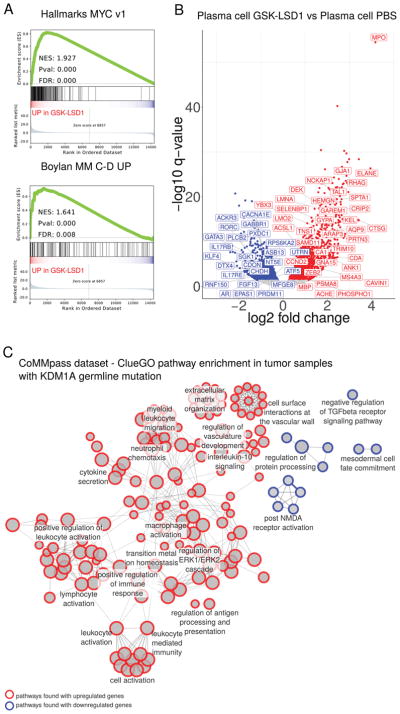
Figure 4. KDM1A inhibition in mouse plasma cells and germline KDM1A mutations in MM patients alters gene expression.
A. Gene set enrichment analysis (GSEA) of differentially expressed genes in plasma cells from mice treated with GSK-LSD1 in MYC v1 MSigDB Hallmark (top) and Bcl-xL/Myc transgenic mouse MM (bottom) gene sets. FDR, False Discovery Rate. NES, normalized enrichment score. B. Volcano plot of differentially expressed genes in sorted plasma cells from mice treated with GSK-LSD1. Labels (human nomenclature) indicate genes differentially regulated in common for both GSK-LSD1 treated mouse plasma cells and MM tumors from KDM1A germline predicted mutation carriers. C. ClueGO analysis pathways enriched in differentially expressed genes comparing MM tumors from KDM1A germline mutation carriers to those from wild-type patients. Pathways with adjusted P-value <0.05 are shown. Circles represent pathways. Size represents the percentage of genes shared with a pathway. Red, upregulated gene pathways. Blue, downregulated gene pathways. Edges (lines) indicate shared genes between pathways.

