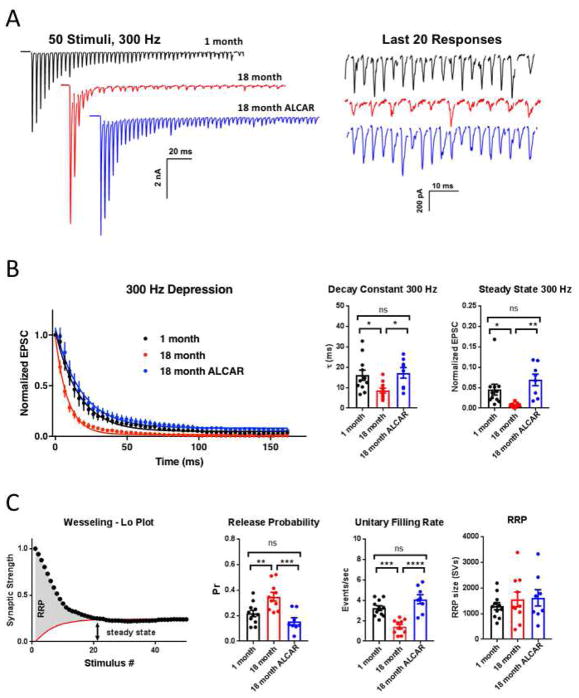
Figure 5. High-frequency stimulation at 300 Hz reveals defects in refilling kinetics underlie enhanced depression.
A. Representative traces showing responses to 300 Hz stimulus train. Left panel shows expanded traces near the end of the stimulus train, illustrating transmission failures in synapses from 18-month old mice (red). B. Summary plot of EPSC amplitude during the train, normalized to the amplitude of the first response. Summary plot of the paired pulse ratio, decay constant and steady-state, per cell, from monoexponential fit to decay curves. Steady-state was measured as average response near the end of the train, between 133–165 ms. C. Illustration of exponential fit method for estimating RRP size, as per Wesseling and Lo, 2002. A constant unitary refilling rate was used to estimate refilling. Summary data of release probability, unitary refilling rate, and readily-releasable pool estimates were generated per cell.

