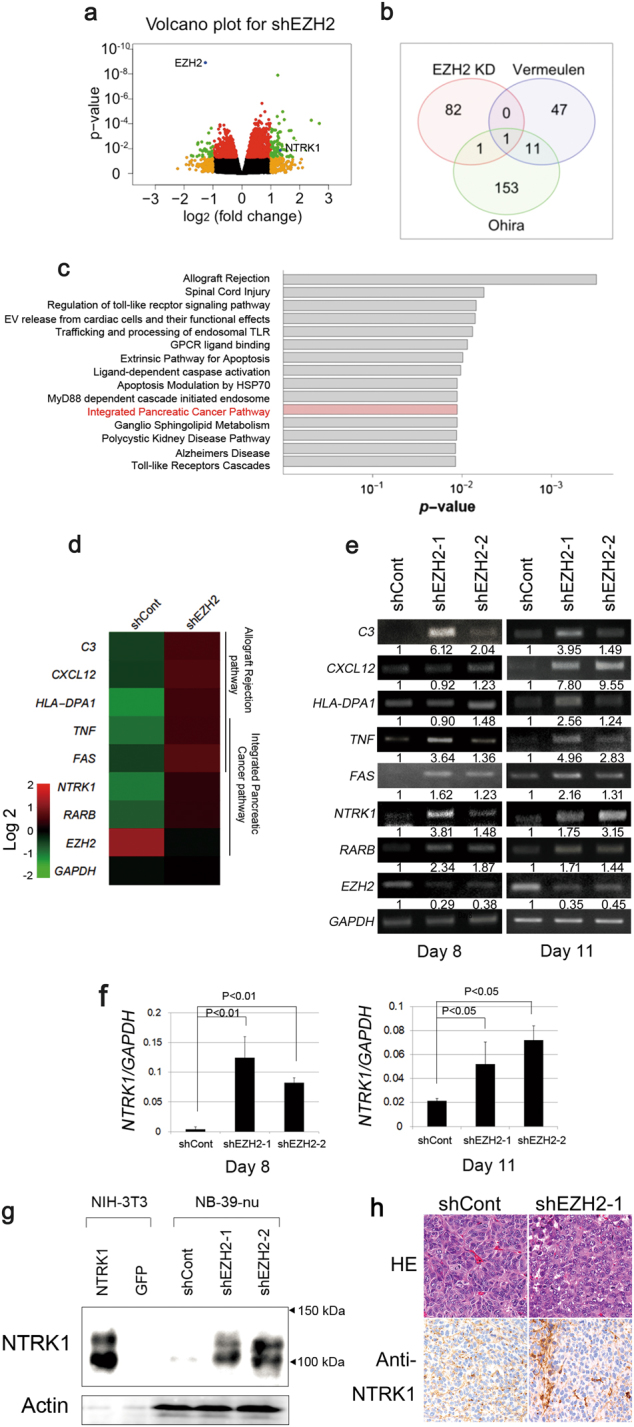
Fig. 2.

EZH2 depletion induces NTRK1. NB-39-nu cells were infected with shEZH2-1 or shEZH2-2 lentiviruses as indicated in the Materials and Methods. Total RNAs were extracted 8 or 11 days after infection when neurite extension was evaluated. Results are representative of at least three independent experiments. a Summary for the transcriptome analysis in the volcano plot. We compared average gene expression levels between mock sample groups and EZH2 KD sample groups 8 and 11 days after infection. The threshold was set for p-values in the t-test (<0.05 after Benjamin–Hochberg corrections, y-axis) and fold changes (>2 in absolute fold changes, x-axis). b Genes upregulated by more than two-fold (p < 0.05) in EZH2 knocked down (by both shEZH2-1 and shEZH2-2) NB-39-nu cells were selected from samples on days 8 and 11 (84 genes in Supplementary Table S2, green dots in Fig. 2a positive fold changes). Venn diagram of the overlap among the upregulated genes in EZH2 KD samples, prognosis-related genes reported by Vermeulen et al. [27], and those reported by Ohira et al. [28]. NTRK1 was included in all data. c Results of a pathway analysis by GeneSpring GX 13.1 for genes upregulated by more than two-fold (p < 0.05) in EZH2 knocked down cells (by shEZH2-1 and shEZH2-2). Red indicates the pathway including NTRK1. d A heatmap generated from microarray data indicates the upregulation of some representative genes, which were involved in the top pathways in c. e The expression of genes indicated in d was confirmed by semi-quantitative RT-PCR. f qPCR analysis of NTRK1. g NTRK1 induction by EZH2 KD was confirmed by WB. h In the NB-39-nu/shEZH2-1-treated tumors (Fig. 1e), NTRK1-positive cells were distributed throughout the tumor tissue both as single cells and in clusters, while scattered NTRK1-positive cells were seen in the NB-39-nu/shCont-treated tumors
