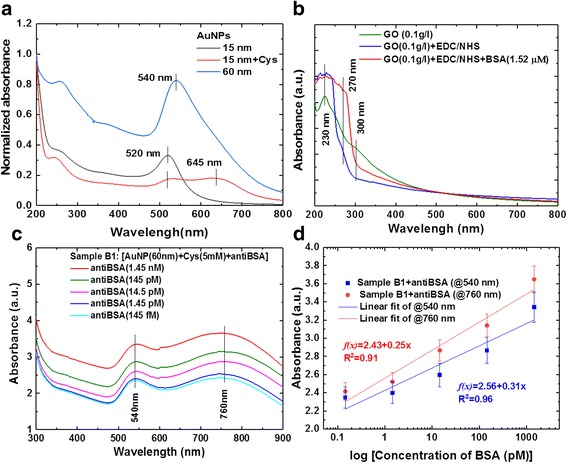
Fig. 5.

Analysis of UV-vis absorption spectra for AuNP with antiBSA interaction response. a SP absorption spectra of AuNPs, b GO-bound BSA, c AuNP-anti-BSA probe, and d Calibration curves for AuNP with antiBSA interaction response at dilution different concentrations of antiBSA protein from 1.45 nM~145 fM
