
Fig. 2.
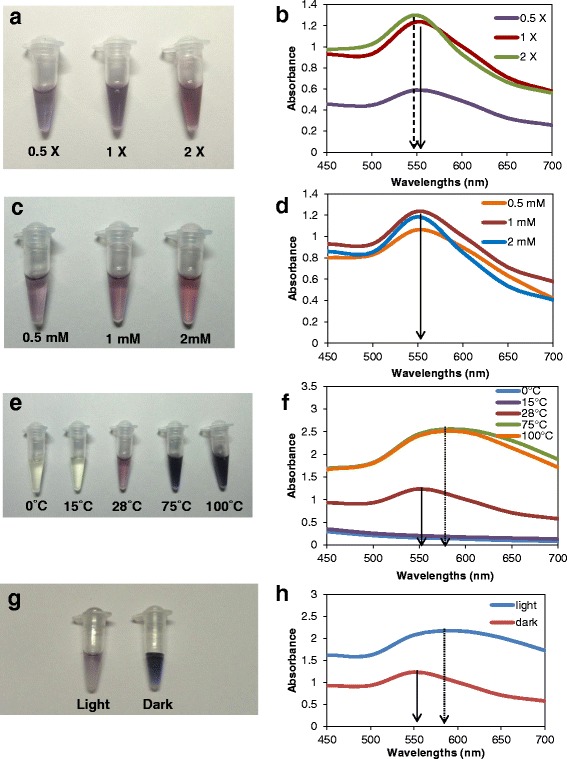
Biosynthesis and UV-vis spectroscopy of AuNPs from Tricholoma crassum using different synthesis parameters. a, b Different concentrations of cell-filtrate. c, d Different concentrations of HAuCl4. e, f Different reaction temperatures. g, h In dark and under light. Solid arrow shows the typical absorption peak at 552 nm for × 1 cell filtrate and 1 mM HAuCl4 at 28 °C pH 5.5 and dashed arrow indicates blue shift of absorption maxima, dotted arrow shows red shift in SPR band