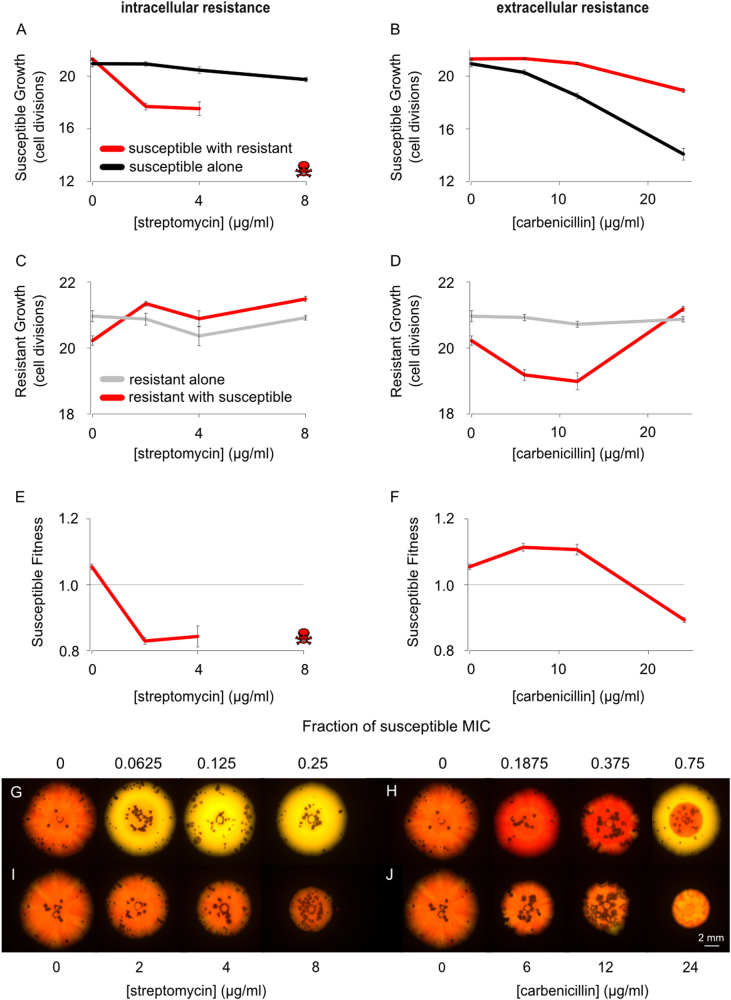
Fig. 2.
Natural selection for resistance in bacterial colonies. Susceptible and resistant strains were competed over 7 days on solid agar with either streptomycin (intracellular resistance) or carbenicillin (extracellular resistance). On streptomycin, resistant strains outcompete susceptible strains at all concentrations of antibiotic (a, red line denotes susceptible growth in the presence of the resistant strain, black line denotes susceptible growth alone), where skulls denote that no colony-forming units of the susceptible strain were observed. However, the resistant strain increased the growth rate of the sensitive strain in the presence of carbenicillin, demonstrating cross-protection (b). Resistant growth increases in the presence of streptomycin when the susceptible strain is present (c, red line denotes resistant growth in the presence of the susceptible strain, grey line denotes resistant growth alone) but is suppressed by the presence of the susceptible strain on carbenicillin (d, red line denotes resistant growth in the presence of the susceptible strain, grey line denotes resistant growth alone). This relative increase in resistant growth, on streptomycin, with the susceptible strain, is expected from a competition effect, specifically the resistant strain outcompeting the susceptible strain for resources more effectively than against another resistant strain. Streptomycin always selects for resistance (e), whereas low doses of carbenicillin select for the sensitive strain (f). Representative images of the colonies in which yellow resistant and red susceptible strains are competed over 6 days, also demonstrate this result (g, h) while control colonies, in which both colours are susceptible, show the effect of these concentrations of antibiotic on non-resistant cells (i, j). The mean and standard error of two experiments, each with n = 6 for co-cultures and n = 3 for monocultures, are shown (Colour figure online). See also Supplementary Figs. S2 and S3

