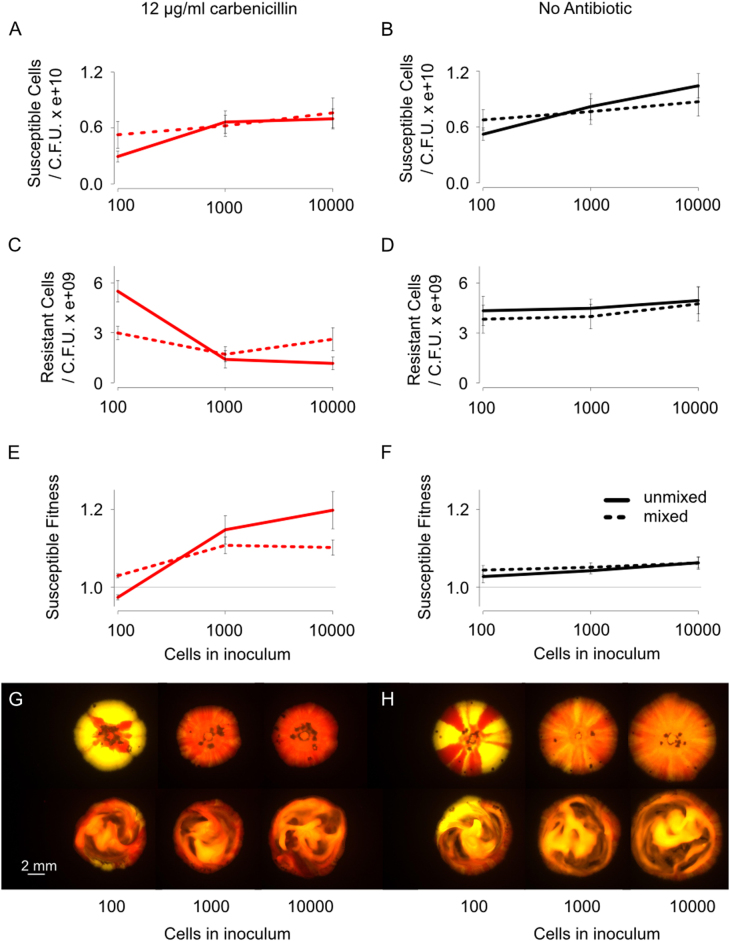
Fig. 4.
Spatiogenetic structure and the evolution of antibiotic resistance. Susceptible (red) and resistant (yellow) strains were co-inoculated onto plates containing either no antibiotic (black line) or 12 μg/ml carbenicillin (red line) (a–d). Final cell counts are shown here, as opposed to cell divisions (Figs. 1 and 2), because the use of different densities itself changes the number of cell divisions that occur (low cell density treatments experienced reduced nutrient competition and increased cell division). The final cell count removes this effect and is an easier metric to interpret. The growth data is shown in the Supplementary Information (Supplementary Fig. S5). From this data, the relative susceptible fitness was calculated (e, f). The extent of separation between susceptible and resistant strains in a colony can be varied with the number of inoculating cells, as can be seen in images taken after 6 days (g, h). Mixing (dotted line, bottom row of g and h) decreases the fitness of the resistant strain in colonies with a low initial density (colonies in LHS row in g go redder upon mixing (bottom row)) and increases fitness in colonies with a high initial density (colonies in middle and RHS row go yellower upon mixing, bottom row). The mean and standard error of two experiments, each with n = 3, are shown (Colour figure online). See also Supplementary Fig. S5

