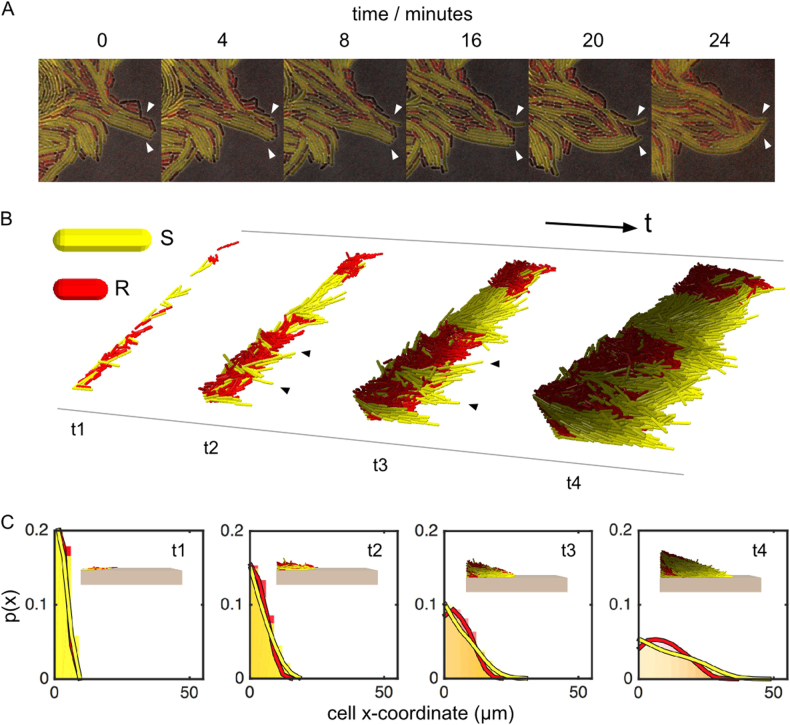
Fig. 6.
Cell shape is important for competition at the edge of colonies. Micrographs show longer susceptible cells (yellow) extending from the colony edge and occluding shorter resistant cells (red). This is shown in time-lapse images of growth at the edge of a representative colony after 10 h, growing on 12 μg/ml carbenicillin (a). These images differ in quality from earlier images (e.g., Fig. 5) because we had to use a lower fluorescence intensity to avoid bleaching during time-lapse imaging. An individual-based model shows the same effect (b). In the model, we can alter cell shape alone and follow its effects on cell sorting. Starting from a random configuration of Susceptible (S) and Resistant (R) cells in a 1:1 mixture, at t1, we observe that long cells extend from the colony edge (t2, black arrows). This improves their resource access and, as in our experiments, allows them to occlude the shorter cells from the edge. This, in turn stimulates further growth (t3, black arrows). By t4, S cells have become enriched at the colony edge through positive feedback. Histograms of cell x-coordinates track the growth of the colony edge and quantify the shape-driven enrichment process in the individual-based model, taken at the same 4 time points as in b (c). p(x) shows the probability of finding a given strain at a given point in the colony. Data merged from a sample of 20 simulations; times t1–t4 correspond to 12, 24, 36 and 56 h of growth, respectively. The colour brightness intensity of each cell corresponds to its growth rate, with brighter cells indicating faster growth (Colour figure online). See also Supplementary Fig. S6

