
Fig. 4.
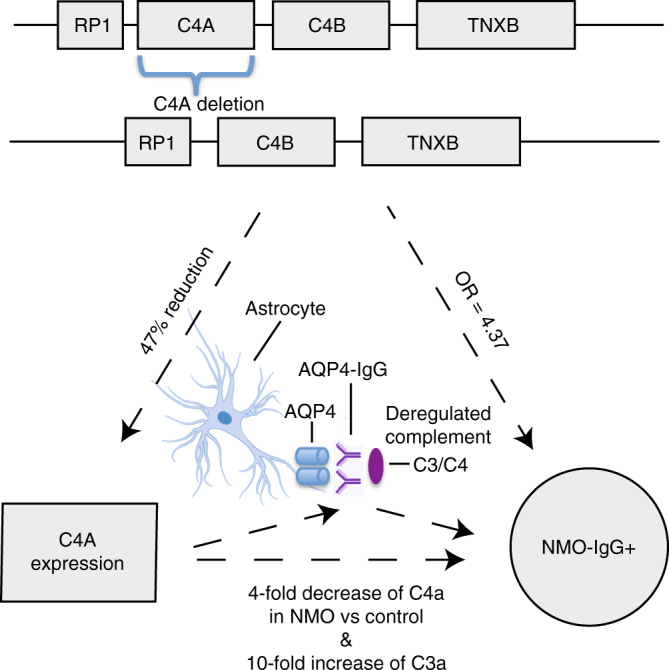
Evidence from human genetics for C4 as a functional role on NMO-IgG+ pathogenesis. Figure representing the main lines of evidence converging on C4A deletion as the most likely functional driver for the association with increased risk for NMO-IgG+. Three vertices of the triangle represent observations on (1) DNA variation, (2) gene expression, and (3) phenotype. The sides of the triangle represent the connection between the mentioned vertex. Each box at the top of the figure represents genes near C4A and C4B. Lines between genes are intergenic regions, in the second row it is depicted the effect of losing one copy of CA4 at the DNA level. More complex rearrangements with lower frequencies ( < 1%) in the general population have been described but are omitted here for simplicity. The 47% reduction in C4A expression for each C4A deleted gene was estimated in brain tissue10. The fourfold decrease of C4a and the 10-fold increase of C3a in NMO vs. the control were measured in serum11