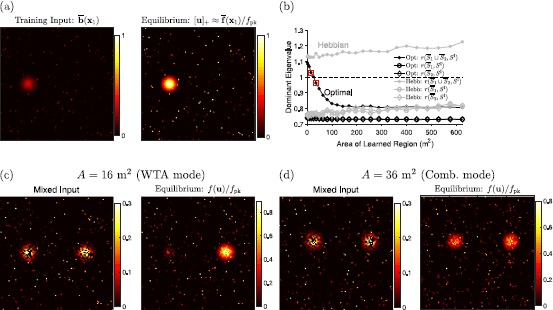
Fig. 1.

Activity bumps on the megamap. (a) When driven by the training input, , the equilibrium state corresponds to a localized activity bump well approximated by the embedded activity pattern, (Eq. (2)). The training input and activity bump are visualized by plotting and for each place cell i redundantly at each of its preferred locations (Fig. 2(a)–(b)). (b) The numerical test for the operational mode (Eq. (3)) predicts that the optimal megamap transitions from the WTA mode to the combinatorial mode at about 25 m2, while the Hebbian megamap is always in the WTA mode. The filled circles indicate the values of (Eq. (3)) for the optimal (black) and Hebbian (gray) weights, where is the set of all cells active in the embedded pattern at location , and since the inhibitory unit is active. The two squared points indicate values for the megamaps simulated in (c) and (d). The open circles and diamonds indicate the values of , or Eq. (3) evaluated at any activity bump proportional to exactly one embedded activity pattern. All such activity bumps are stable. The “Dominant Eigenvalue” refers to the maximal eigenvalue computed in Eq. (3). (c) When the optimal megamap representing 16 m2 is driven by a mixed external input (left), only one prominent activity bump persists in time (right). The external input is formed by choosing two well-separated locations and , setting for a randomly selected 50% of the cells, and setting for the remaining cells. The activity bump scaled by is equivalent to . (d) When the optimal megamap representing 36 m2 is driven by an external input set in the same manner, activity bumps representing both locations persist in time
