Fig. 2.

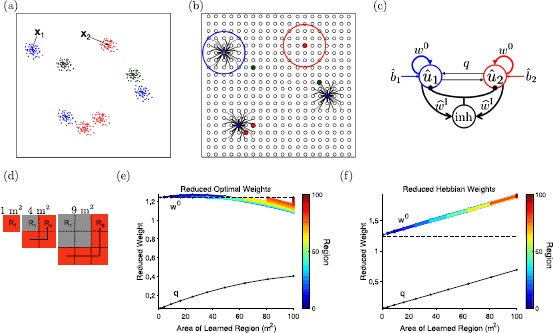
Reduction of the megamap model to the 2-unit model. (a) Schematic showing idealized place fields of three different place cells, where the green cell has two place fields, and the red and blue cells each have three place fields. In the megamap model, the place fields of each cell are set randomly according to the Poisson distribution. The two-unit model is an approximation of the megamap driven by an external input encoding two locations, denoted by and . (b) Each place cell is plotted redundantly on the megamap at each of its preferred locations. For both the optimal and the Hebbian megamaps, each place cell has recurrent connections to each set of its neighbors. Idealized connections from the blue cell are shown. The place cells inside the large blue and red circles are the cells included in unit 1 and unit 2, respectively. (c) The two-unit model (Eq. (5)) has the same form as the megamap model (Eq. (1)). The reduced state variables and reduced external input, and (Eq. (6)), represent the collective state and collective external input into place cells near location , indicated by the blue and red circles in (b). The reduced weights, and q (Eq. (7)), are related to the strength of connections within a unit and between units, respectively. For this example, there should be a relatively weak cross-connection q since the blue and red cells are neighbors elsewhere in the environment. The reduced inhibitory weight is proportional to the inhibitory weight of the megamap (Eq. (7)). (d)–(f) We compute the reduced weights for a megamap that models an animal incrementally learning a square environment of increasing size [10]. The first three iterations are illustrated in (d). At each iteration, the recurrent weights are updated to incorporate the novel subregions (red) into the learned environment (gray). Previously learned subregions are not reinforced in later iterations. For the optimal weights (e), the average recurrent excitation (proportional to ) within a unit changes little over the first 100 m2 compared to the increase in the average weight between units (proportional to q) as the environment grows in size. For the Hebbian weights (f), and q increase linearly at roughly the same rate. The color in (e) and (f) indicates the region number (the first nine regions are shown in (d))
