Abstract
Fatty liver disease is one of the leading causes of chronic damage in western countries. Approximately 25% of adults in the United States have fatty livers in the absence of excessive alcohol consumption, a condition termed nonalcoholic fatty liver disease (NAFLD). Little is known about the prevalence and genetic background of NAFLD or the factors that determine its development. In this study, we used the Gene-Cloud of Biotechnology Information bioinformatics platform to carry out a comprehensive bioinformatics analysis identifying differentially expressed genes (DEGs), key biological processes and intersecting pathways. We imported 3 Gene Expression Omnibus datasets (GSE66676, GSE49541, and GSE83452). Then, we assessed the expression of the DEGs in clinical samples. We found that CD24 was the only gene co-expressed in all 3 datasets. “Glycolysis/gluconeogenesis”, “p53 signaling pathway” and “glycine, serine and threonine metabolism” were 3 common pathways related to the fatty liver process. In NAFLD tissues, CD24, COL1A1, LUM, THBS2 and EPHA3 were upregulated, and PZP was downregulated. CD24 is a core gene among these DEGs and have not yet been studied of its impact on NAFLD. Co-expressed genes, common biological processes and intersecting pathways identified in the study might play an important role in NAFLD progression. Further studies are needed to elucidate the mechanism of these potential genes and pathways in NAFLD.
Subject terms: Gene expression, Genomics
Introduction
Nonalcoholic fatty liver disease (NAFLD) and its subtype nonalcoholic steatohepatitis (NASH) have become an increasingly important clinical and economic burden for public health1,2. NAFLD is the leading cause of liver damage and dysfunction in the western world and is strongly associated with obesity and insulin resistance3. Fatty liver could subsequently develop to malignancy and end-stage liver failure4–6. Currently, NAFLD is a leading indication for liver transplantation in the United States7. Mechanistic, preclinical, and clinical studies provided an initial view into NAFLD progression along with the process from NAFLD to NASH and fibrosis8,9. However, owing to the epidemics of NAFLD and the unclear mechanism of NAFLD progression, it is important to elucidate the underlying NAFLD mechanisms in detail.
Gene profiling experiments in cross-sectional studies have been useful in identifying factors involved in NAFLD progression10–12. Gene profiling studies identified novel targets of NAFLD and demonstrated the roles of specific metabolic and repair pathways in the disease11. In the present study, we carried out a comprehensive bioinformatics analysis between normal liver tissues and NAFLD/NASH tissues on the Gene-Cloud of Biotechnology Information (GCBI) bioinformatics platform. Based on the comprehensive bioinformatics analysis, we determined to identify key differentially expressed genes (DEGs), biological processes and pathways that are closely associated with NAFLD/NASH.
Materials and Methods
Gene expression omnibus datasets
The Gene Expression Omnibus (GEO) (https://www.ncbi.nlm.nih.gov/gds) is a public repository at the National Center of Biotechnology Information for storing high-throughput gene expression datasets. We selected potential GEO datasets according to the following inclusion criteria: 1) specimens had histological diagnosis; 2) human liver tissues diagnosed as hepatocyte steatosis for the experimental group; 3) normal liver tissues used as controls; 4) expression profiling by array and raw data had the CEL format; 5) performed on the GPL570 platform ([HGU133_Plus_2] Affymetrix Human Genome U133 Plus 2.0 Array) and Human Exon 1.0 ST v1 Array; and 6) supported by GCBI analysis laboratory. Datasets with specimens from other organisms, expression profiling by RT-PCR (or genome variation profiling by SNP array/SNP genotyping by SNP array), analyses on platforms other than GPL570, or sample size <10 were excluded.
We used the search terms “Fatty liver” [MeSH Terms] AND “Homo sapiens” [Organism] and “Non-alcoholic” [Description] and “CEL” [Supplementary Files] and “Expression profiling by array” [DataSet Type] in the GEO DataSets to identify potential datasets. Then, we further screened these datasets according to the above inclusion criteria. Finally, 3 GEO datasets, GSE66676, GSE49541, and GSE83452, were included in our study.
Gene-Cloud of Biotechnology Information (GCBI)
GCBI (Shanghai, China, https://www.gcbi.com.cn) is an online comprehensive bioinformatics analysis platform that combines a variety of research findings, genetic information, sample information, data algorithms and bioinformatics to create a “gene knowledge base,” which involves GEO datasets. GCBI platform can systematically analyze GEO dataset-derived gene expression information13, including more than 120 million copies of genomic samples. In the present study, GCBI was used to identify DEGs between NAFLD/NASH liver tissues and normal liver tissues. In the Differential Gene Expression Analysis module on the GCBI platform, we identified DEGs with a fold expression change >5 at cut off values Q < 0.05 and P < 0.05. Venn diagrams were used to compare the top 100 DEGs from 3 cohorts by Venny (http://bioinfogp.cnb.csic.es/tools/venny/index.html). Based on the DEGs, we further performed gene ontology (GO) analysis in terms of biological functions and Kyoto Encyclopedia of Genes and Genomes (KEGG) analysis in terms of pathway analysis. The top 20 biological functions and pathways are presented. Furthermore, a pathway relation network module was used to identify the core networks and pathway connections. Then, we applied the Gene Co-expression Network module on the GCBI platform to build gene co-expression networks for the DEGs to determine core genes in the networks.
Tissue specimens, RNA extraction and qRT-PCR analysis
15 healthy liver tissues and 10 fatty liver tissues from liver donors were enrolled in our study to validate the expression levels of co-expressed DEGs. Prior patient consent and ethical approval from the ethics committee of the First Affiliated Hospital, Sun Yat-sen were obtained. All methods were performed in accordance with the ethics guidelines and regulations. We selected 8 co-expressed DEGs, including CD24, PZP, COL1A1, COL1A2, LUM, VCAN, THBS2 and EPHA3, for validation. All tissues were histologically diagnosed. Total RNA from the tissue specimens was isolated using TRIzol reagent (Invitrogen, Carlsbad, California, USA), and qRT-PCR was performed with SYBR® Green dye (TaKaRa, Shiga, Japan), following the manufacturer’s instructions. The primer sequences are provided in Supplementary Table S1. β-tubulin was used as a reference gene.
Ethics statement
The research protocol was reviewed and approved by the Research Ethics Committee of the First Affiliated Hospital, Sun Yat-sen. All experiments were conducted in accordance with approved guidelines of the First Affiliated Hospital, Sun Yat-sen University.
Ethical approval
All procedures performed in studies involving human participants were in accordance with the ethical standards of the ethical committee of the First Affiliated Hospital, Sun Yat-sen University were obtained and with the 1964 Helsinki Declaration and its later amendments or comparable. NO tissues were procured from prisoners. All the livers were procured in Organ Transplant Center, The First Affiliated Hospital, Sun Yat-sen University.
Ethical standards
Informed consent was obtained from all individual participants included in the study.
Statistical analysis
Data are presented as the mean ± SD for continuous variables. Student’s t-test and analysis of variance were used to evaluate significant differences in demographic data. All P values were two-sided, and P < 0.05 was defined as statistically significant. Analyses were carried out by the Statistical Package for the Social Science (SPSS) 22.0 (IBM, USA).
Results
Study design
The flow diagram of our study design is shown in Fig. 1. Our initial aim was to identify core genes in the development of fatty liver. We used 3 GEO datasets (GSE66676, GSE49541, and GSE83452) in the GCBI bioinformatics analysis platform. We extracted gene expression data of NAFLD/NASH and normal liver tissues to identify DEGs between the two histological diagnosis types in these 3 cohorts. Co-expressed DEGs were identified based on these DEGs. Biological function and KEGG pathway analyses were then performed. Finally, we verified expression of the core co-expressed genes in clinical samples to confirm the results.
Figure 1.
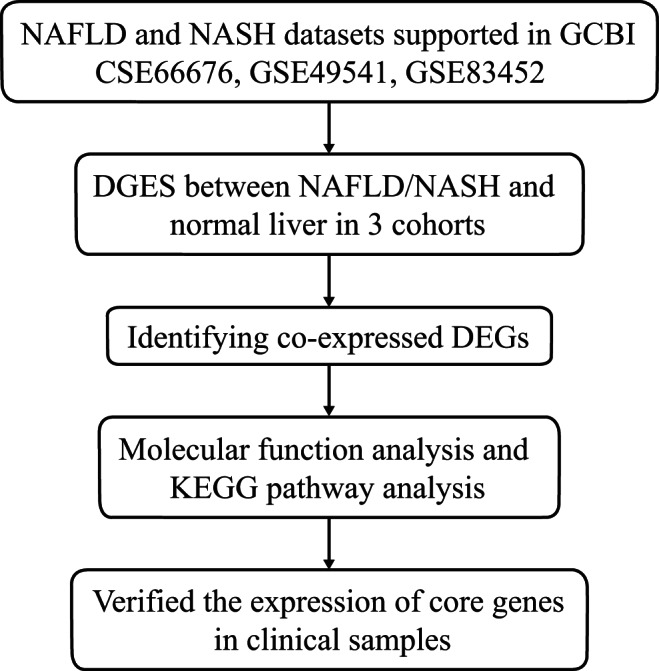
Flow diagram of the study design. NAFLD, nonalcoholic fatty liver disease; NASH, nonalcoholic steatohepatitis; DEGs, differentially expressed genes; KEGG, Kyoto Encyclopedia of Genes and Genomes.
Major characteristics of samples in 3 datasets
GEO datasets GSE66676 (Cohort 1), GSE49541 (Cohort 2), and GSE83452 (Cohort 3) were enrolled in our study. All 3 datasets were available in the GCBI bioinformatics analysis platform. GSE66676 contained 33 NAFLD or NASH tissues and 34 normal liver tissues. GSE49541 contained 32 advanced NAFLD tissues and 40 mild NAFLD tissues. GSE83452 included 126 NASH tissues and 98 normal liver tissues.
DEGs between NAFLD/NASH and normal liver tissues
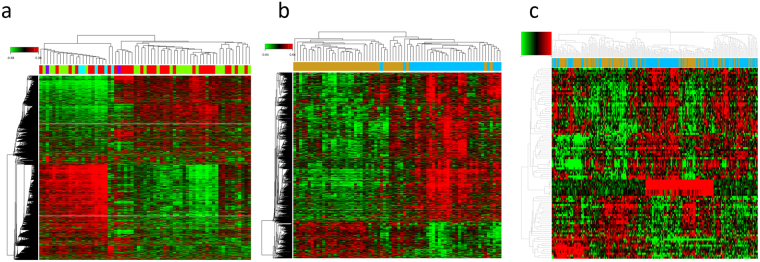
We identified 8503, 1538, and 94 potential DEGs in GSE66676, GSE49541, and GSE83452, respectively (Fig. 2a–c). The top 10 DEGs from 3 cohorts are shown in Tables 1–3. After removing duplicate genes and expression values lacking specific gene symbols, we used the top 100 DEGs from GSE66676 and GSE49541 and 93 DEGs from GSE83452 to create a Venn diagram. The intersection of these 3 datasets in Fig. 3 shows that CD24 was the only co-expressed DEG found in all 3 cohorts. Twelve genes were co-expressed in Cohort 1 and Cohort 2, including COL1A1, COL1A2, MOXD1, LUM, VCAN, EFEMP1, THBS2, MGP, COL3A1, EPHA3, BICC1, and COL6A3, all of which were upregulated. Seventeen genes were co-expressed in Cohort 1 and Cohort 3, including SPP1, FABP4, PZP, UTY, SLC1A2, GPNMB, DDX3Y, SAA1, MT1M, FAT1, USP9Y, LYZ, CXCL10, VIL1, EIF1AY, UBD, and CYP3A43. Further investigation showed that the regulation of MT1M, SLC1A2, CYP3A43 and VIL1 was not consistent. Therefore, 13 genes were co-expressed in Cohort 1 and Cohort 3.
Table 2.
Top 10 differentially expressed genes in Cohort 2.
| Rank | Probe Set ID | Gene Symbol | Gene Description | Regulation |
|---|---|---|---|---|
| 1 | 201842_s_at | EFEMP1 | EGF containing fibulin-like extracellular matrix protein 1 | Upregulation |
| 2 | 201843_s_at | EFEMP1 | EGF containing fibulin-like extracellular matrix protein 1 | Upregulation |
| 3 | 205422_s_at | ITGBL1 | integrin, beta-like 1 | Upregulation |
| 4 | 201744_s_at | LUM | lumican | Upregulation |
| 5 | 214247_s_at | DKK3 | dickkopf WNT signaling pathway inhibitor 3 | Upregulation |
| 6 | 213071_at | DPT | dermatopontin | Upregulation |
| 7 | 1557080_s_at | ITGBL1 | integrin, beta-like 1 (with EGF-like repeat domains) | Upregulation |
| 8 | 206070_s_at | EPHA3 | EPH receptor A3 | Upregulation |
| 9 | 207173_x_at | CDH11 | cadherin 11, type 2, OB-cadherin | Upregulation |
| 10 | 209291_at | ID4 | inhibitor of DNA binding 4 | Upregulation |
Figure 2.
(a–c) Heat maps for potential DEGs between fatty liver and normal liver tissues in 3 cohorts. Heat maps for potential DEGs in GSE66676 (containing 33 NAFLD/NASH tissues and 34 normal liver tissues) (a), GSE49541 (containing contained 32 advanced NAFLD tissues and 40 mild NAFLD tissues) (b), and GSE83452 (126 NASH tissues and 98 normal liver tissues) (c).
Table 1.
Top 10 differentially expressed genes in Cohort 1.
| Rank | Probe Set ID | Gene Symbol | Gene Description | Regulation |
|---|---|---|---|---|
| 1 | 7903765 | GSTM1 | glutathione S-transferase mu 1 | Downregulated |
| 2 | 8096301 | SPP1 | secreted phosphoprotein 1 | Upregulated |
| 3 | 8151532 | FABP4 | fatty acid binding protein 4 | Upregulated |
| 4 | 7960984 | PZP | pregnancy-zone protein | Downregulated |
| 5 | 7914000 | NR0B2 | nuclear receptor subfamily 0, group B, member 2 | Downregulated |
| 6 | 8174474 | ACSL4 | acyl-CoA synthetase long-chain family member 4 | Upregulated |
| 7 | 7908481 | CFHR3 | complement factor H-related 3 | Upregulated |
| 8 | 8136336 | AKR1B10 | aldo-keto reductase family 1, member B10 | Upregulated |
| 9 | 8150920 | CYP7A1 | cytochrome P450, family 7, subfamily A, polypeptide 1 | Upregulated |
| 10 | 7948420 | FABP5 | fatty acid binding protein 5 | Upregulated |
Table 3.
Top 10 differentially expressed genes in Cohort 3.
| Rank | Probe Set ID | Gene Symbol | Gene Description | Regulation |
|---|---|---|---|---|
| 1 | 16829985 | ENO3 | enolase 3 (beta, muscle) | Upregulation |
| 2 | 16766132 | APOF | apolipoprotein F | Downregulation |
| 3 | 16895179 | TP53I3 | tumor protein p53 inducible protein 3 | Upregulation |
| 4 | 17104259 | MSN | moesin (MSN) | Upregulation |
| 5 | 16789484 | ADSSL1 | adenylosuccinate synthase like 1 (ADSSL1) | Upregulation |
| 6 | 16977052 | CXCL10 | chemokine (C-X-C motif) ligand 10 | Upregulation |
| 7 | 16890891 | VIL1 | villin 1 | Downregulation |
| 8 | 16909401 | SLC16A14 | solute carrier family 16, member 14 | Upregulation |
| 9 | 16811975 | TSPAN3 | tetraspanin 3 | Upregulation |
| 10 | 16841768 | CENPV | centromere protein V | Downregulation |
Figure 3.
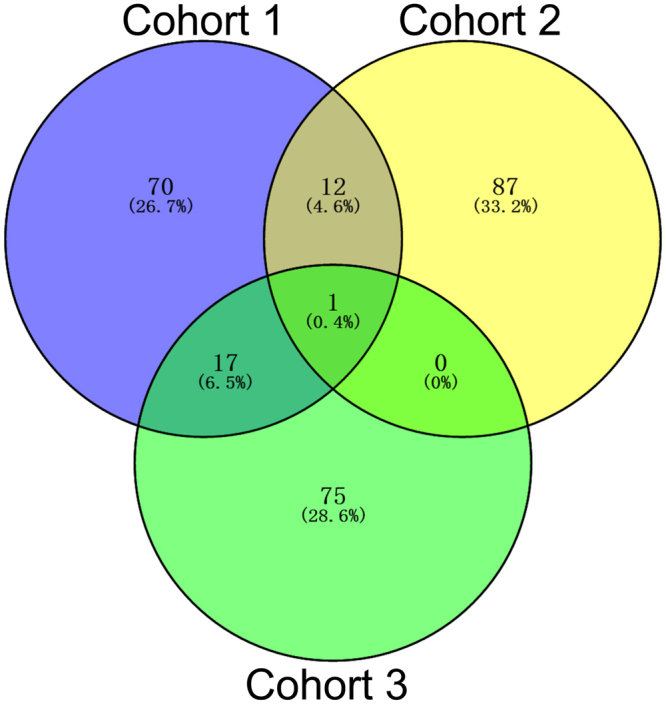
The Venn diagram shows the top 100 DEGs and co-expressed genes among cohort 1 (GSE66676), cohort 2 (GSE49541) and cohort 3 (GSE83452).
Biological process analysis
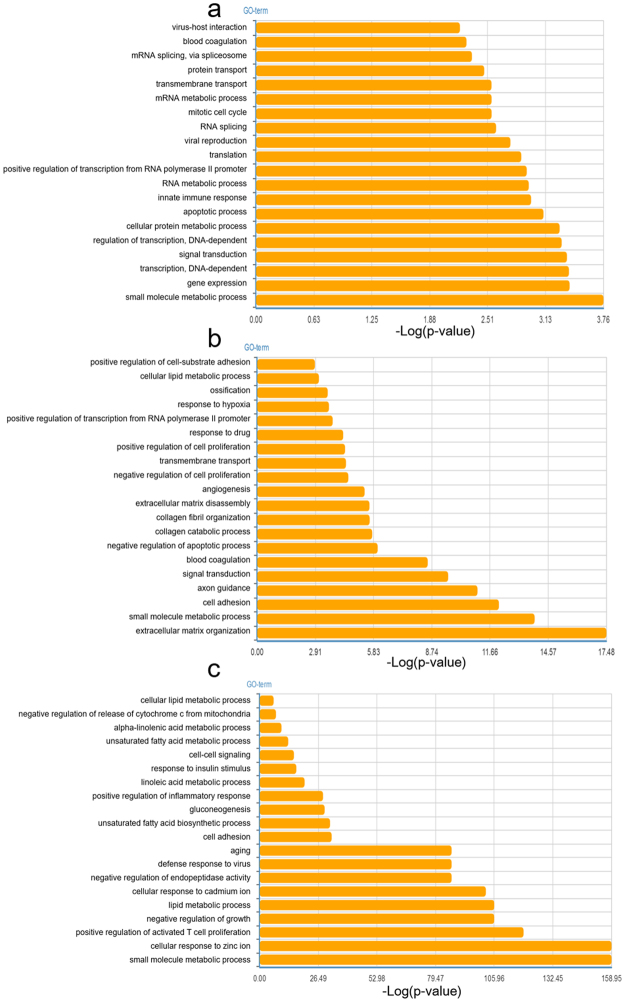
In the present study, GO analysis was applied to investigate the biological function of the DEGs. The biological process analysis (Fig. 4a–c) revealed that “small molecule metabolic process” was a common biological function in 3 cohorts. “Cellular lipid metabolic process” and “cell adhesion” were the common biological processes in Cohort 2 and Cohort 3. Four common biological processes in Cohort 1 and Cohort 2 were “blood coagulation, transmembrane transport, positive regulation of transcription from RNA polymerase II promoter and signal transduction”. Metabolic processes, such as “alpha-linolenic acid metabolic process, unsaturated fatty acid metabolic process, mRNA/RNA metabolic process” and other biological processes, were also vital in each cohort.
Figure 4.
(a–c) Top 20 biological functions in terms of GO analysis related to DEGs in cohort 1 (a), cohort 2 (b) and cohort 3 (c).
Pathway analysis
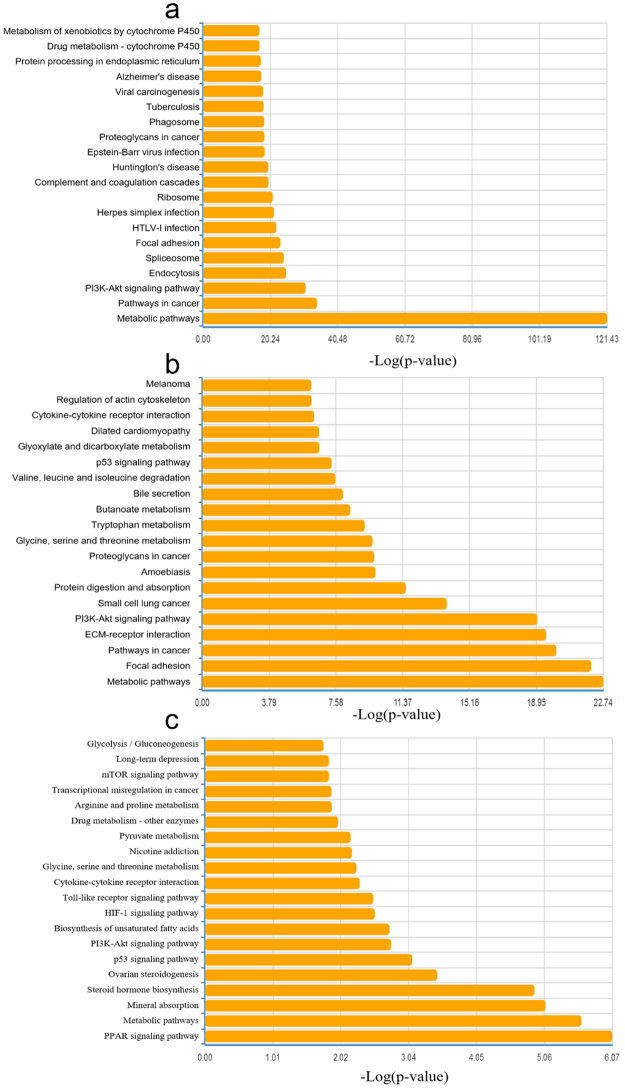
KEGG pathway analysis were used to investigate the pathway based on the DEGs identified. Figure 5a–c shows the top 20 pathways involved in each cohort. Among them, glycine, serine and threonine metabolism; cytokine-cytokine receptor interaction; PI3K-Akt signaling pathway; p53 signaling pathway; and metabolic pathways were 5 common pathways related to the fatty liver process. Among the top ten pathways in the pathway relation network in 3 cohorts, “glycolysis/gluconeogenesis”, “p53 signaling pathway” and “glycine, serine and threonine metabolism” were 3 intersecting pathways in the relation network (Table 4). MAPK signaling pathway, apoptosis, pathways in cancer, cell cycle, Wnt signaling pathway and pyruvate metabolism were the other intersecting pathways in pairwise comparisons.
Figure 5.
(a–c) Top 20 pathways in terms of KEGG pathway analysis related to DEGs in cohort 1 (a), cohort 2 (b) and cohort 3 (c). (d–f) Pathway relation network in 3 cohorts.
Table 4.
Top 10 pathways in pathway relation network of the 3 cohorts.
| Rank | Cohort 1 | Cohort 2 | Cohort 3 |
|---|---|---|---|
| 1 | MAPK signaling pathway | MAPK signaling pathway | Pyruvate metabolism |
| 2 | Apoptosis | Pathways in cancer | Glycolysis/Gluconeogenesis |
| 3 | Pathways in cancer | Apoptosis | Fatty acid biosynthesis |
| 4 | Cell cycle | Cell cycle | Glycine, serine and threonine metabolism |
| 5 | Glycolysis/Gluconeogenesis | p53 signaling pathway | Prostate cancer |
| 6 | p53 signaling pathway | Pyruvate metabolism | Cytokine-cytokine receptor interaction |
| 7 | Glycine, serine and threonine metabolism | Glycolysis/Gluconeogenesis | Toll-like receptor signaling pathway |
| 8 | Calcium signaling pathway | Wnt signaling pathway | p53 signaling pathway |
| 9 | Citrate cycle (TCA cycle) | Focal adhesion | |
| 10 | Wnt signaling pathway | Glycine, serine and threonine metabolism |
The validation of core genes expression in clinical samples
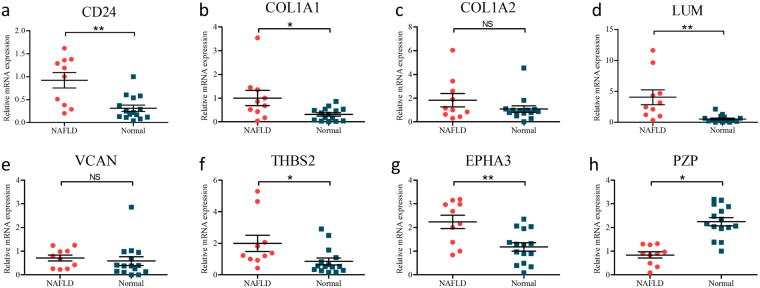
To further determine which genes might play a significant role in the progression of fatty liver, we used real-time qPCR to detect the expression of 8 DEGs using clinical samples, including CD24, PZP, COL1A1, COL1A2, LUM, VCAN, THBS2 and EPHA3. 15 healthy liver tissues and 10 fatty liver tissues from liver donors were enrolled. We noted that CD24, COL1A1, LUM, THBS2 and EPHA3 were usually upregulated in fatty liver tissues comparing to normal liver tissues, which is consistent with the results of bioinformatics analysis above (Fig. 6a–f). PZP was significantly downregulated in fatty livers compared with normal livers, which is also consistent with the co-expressed results (Fig. 6h).
Figure 6.
(a–h) Real-time qPCR validation of 8 co-expressed DEGs in 10 NAFLD and 15 normal liver tissues. *P < 0.05, **P < 0.01, NS represents no significant difference, analysis by non-paired t tests.
Discussion
Non-alcoholic steatohepatitis is strongly associated with strong genetic component and dietary component1. A number of genes could be associated with the susceptibility and development of NAFLD and NASH1,2. In our present study, we imported three GEO datasets into the GCBI comprehensive analysis platform to extract gene expression data of NAFLD/NASH tissue comparing to normal liver tissue or NASH tissue comparing to NAFLD liver tissue. We identified co-expressed DEGs, common biological processes and pathways between NAFLD/NASH and normal liver tissues through differential expression analysis in GCBI.
We found that CD24, PZP, COL1A1, COL1A2, LUM, VCAN, THBS2 and EPHA3 were potential biomarkers for distinguishing NAFLD/NASH. Further validation by clinical samples, the expression of CD24, PZP, COL1A1, LUM, THBS2 and EPHA3 were significantly regulated. Moreover, CD24 is a core gene among these DEGs and have not yet been studied of its impact on hepatocyte steatosis. CD24 encodes a sialoglycoprotein that is expressed on mature granulocytes and B cells and modulates growth and differentiation signals to these cells13. Several studies have reported that CD24 is widely distributed, including on hematopoietic cells14 and non-hematopoietic cells15,16. CD24 has been studied to be associated with various pathophysiological processes, including tracking divergent states of cells17, regulating CD8 (+) T cell activation18 and participating in mutant-IDH1-dependent chromatin state reprogramming19. Accumulating evidence showed that this protein is overexpressed in many types of cancers, resulting in cancer cell growth, proliferation and metastasis20. Previous studies have reported that CD24 is overexpressed in nearly 70% of human cancers, and intracellular CD24 disrupts the ARF-NPM interaction and enables mutational and viral oncogene-mediated p53 inactivation21. CD24 is significantly correlated with tumorigenesis genes, such as non-coding RNAs22. It was previously demonstrated that a subpopulation of adipocyte progenitor cells was identified with the expression of the cell surface molecule CD24 being critically important for reconstitution of white adipose tissue function in vivo23. CD24 was shown to be important in the reconstitution of white adipocyte (WAT) function in vivo, as well as a specific regulator of adipogenesis in vitro23,24. Furthermore, it was demonstrated that losing CD24 in male mice leads to a generalized reduction of WAT and metabolic disturbances24. Fairbridge et al.25. reported that the global absence of CD24 affects adipocyte cell size in vivo in a sex- and diet-dependent manner, as well as causing metabolic disturbances in glucose homeostasis and free fatty acid levels. However, the precise function of CD24 and the underlying mechanisms of its activity in NAFLD/NASH progression remain unclear. This is the first study to identify the prominent correlation between CD24 and NAFLD/NASH.
Insulin resistance (IR) is central in the pathogenesis of NAFLD. NAFLD often significantly impacts glucose and lipid metabolism by exacerbating hepatic IR26. CD24 can regulate lipid raft occupancy and may affect glucose uptake by regulating lipid raft protein localization27. Additional studies will be required to identify whether there is a potential mechanism among CD24, glucose uptake, and insulin resistance. IR is a major factor for hepatic fat accumulation28. Several studies only focused on a single protein, which ignored the various potential pathways in this complex disease29. In our study, we found that “glycolysis/gluconeogenesis”, “p53 signaling pathway” and “glycine, serine and threonine metabolism” were 3 intersecting pathways in the relation network. Several studies have reported that glycolysis/gluconeogenesis30, the p53 signaling pathway31, and glycine metabolism32 were each associated with IR. The biological process “small molecule metabolic process” was reported to be vital in cancer33, hepatic metabolism disorder like IR34. We supposed it to be a key biological process in fatty liver. Further studies will be required to determine whether the co-expressed DEGs including CD24 could activate one of these pathways or other mechanisms to induce NAFLD/NASH in humans.
In summary, we first used the GCBI bioinformatics analysis platform to identify DEGs between NAFLD/NASH tissues and normal liver tissues, which showed that CD24 is the hub gene and identify 3 intersecting pathways in the relation network. Then, using qRT-PCR analysis, we concluded that the mRNA expression of CD24 is upregulated in fatty liver. Further studies are required to elucidate the function and underlining mechanisms of this potential biomarker in the progression of hepatocyte steatosis.
Electronic supplementary material
Acknowledgements
This study was supported by the National Natural Science Foundation of China (81373156, 81471583 and 81570587), Guangdong Provincial international Cooperation Base of Science and Technology (Organ Transplantation) (2015B050501002), Guangdong Provincial Natural Science Funds for Major Basic Science Culture Project (2015A030308010), Guangdong Provincial Natural Science Funds for Distinguished Young Scholars (2015A030306025), Special Support Program for Training High-level Talent in Guangdong Province (2015TQ01R168), Pearl River Nova Program of Guangzhou (201506010014), and the Science and Technology Program of Guangzhou (201704020150), the National Natural Science Foundation of China (grant 81670592), the Natural Science Foundation of Guangdong Province, China (grant 2016A030313242); the Medical Scientific Research Foundation of Guangdong Province, China (grant A2016033), the Science and Technology Program of Guangzhou, China (grant 201804020075), and the Fundamental Research Funds for the Central Universities (grant 17ykjc09), the Program Sci-tech Research Development of Guangdong Province (2014A020212717), and the Science and Technology Program of Huizhou (170520181743174).
Author Contributions
Conceived and designed the study: S.Z.H., C.J.S., Q.Z. and L.W.W.; Searched databases: Y.C.H., Y.H.T. and Z.B.Z.; Data analyses: Z.H.Z., Y.X.Z. and L.H.W.; Preparation of tables and figures: Q.Z., M.G.C., Z.Y.G., D.P.W. and W.Q.J.; Wrote and revised the manuscript: S.Z.H., C.J.S., L.W.W. and X.S.H.; All authors reviewed the manuscript.
Competing Interests
The authors declare no competing interests.
Footnotes
Publisher's note: Springer Nature remains neutral with regard to jurisdictional claims in published maps and institutional affiliations.
Shanzhou Huang, Chengjun Sun and Yuchen Hou contributed equally to this work.
Change history
5/3/2019
A Correction to this paper has been published: 10.1038/s41598-019-39022-7
Contributor Information
Qi Zhou, Email: hnzhouqi@163.com.
Linwei Wu, Email: lw97002@163.com.
Xiaoshun He, Email: gdtrc@163.com.
Electronic supplementary material
Supplementary information accompanies this paper at 10.1038/s41598-018-25658-4.
References
- 1.Williams CD, et al. Prevalence of nonalcoholic fatty liver disease and nonalcoholic steatohepatitis among a largely middle-aged population utilizing ultrasound and liver biopsy: a prospective study. Gastroenterology. 2011;140:124–131. doi: 10.1053/j.gastro.2010.09.038. [DOI] [PubMed] [Google Scholar]
- 2.Younossi ZM, Henry L, Bush H, Mishra A. Clinical and economic burden of nonalcoholic fatty liver disease and nonalcoholic steatohepatitis. Clin. Liver Dis. 2018;22:1–10. doi: 10.1016/j.cld.2017.08.001. [DOI] [PubMed] [Google Scholar]
- 3.Hardy T, Oakley F, Anstee QM, Day CP. Nonalcoholic fatty liver disease: pathogenesis and disease spectrum. Annu. Rev. Pathol. 2016;11:451–496. doi: 10.1146/annurev-pathol-012615-044224. [DOI] [PubMed] [Google Scholar]
- 4.Kim GA, et al. Association between non-alcoholic fatty liver disease and cancer incidence rate. J. Hepatol. 2018;68:140–146. doi: 10.1016/j.jhep.2017.09.012. [DOI] [PubMed] [Google Scholar]
- 5.Wolf MJ, et al. Metabolic activation of intrahepatic CD8 + T cells and NKT cells causes nonalcoholic steatohepatitis and liver cancer via cross-talk with hepatocytes. Cancer Cell. 2014;26:549–564. doi: 10.1016/j.ccell.2014.09.003. [DOI] [PubMed] [Google Scholar]
- 6.Cohen JC, Horton JD, Hobbs HH. Human fatty liver disease: old questions and new insights. Science. 2011;332:1519–1523. doi: 10.1126/science.1204265. [DOI] [PMC free article] [PubMed] [Google Scholar]
- 7.Kim WR, et al. OPTN/SRTR 2015 annual data report: liver. Am. J. Transplant. 2017;17((Suppl 1):174–251. doi: 10.1111/ajt.14126. [DOI] [PubMed] [Google Scholar]
- 8.Wree A, Broderick L, Canbay A, Hoffman HM, Feldstein AE. From NAFLD to NASH to cirrhosis-new insights into disease mechanisms. Nat. Rev. Gastroenterol. Hepatol. 2013;10:627–636. doi: 10.1038/nrgastro.2013.149. [DOI] [PubMed] [Google Scholar]
- 9.Haas JT, Francque S, Staels B. Pathophysiology and mechanisms of nonalcoholic fatty liver disease. Annu. Rev. Physiol. 2016;78:181–205. doi: 10.1146/annurev-physiol-021115-105331. [DOI] [PubMed] [Google Scholar]
- 10.Hanin G, et al. miRNA-132 induces hepatic steatosis and hyperlipidaemia by synergistic multitarget suppression. Gut. 2017 doi: 10.1136/gutjnl-2016-312869. [DOI] [PMC free article] [PubMed] [Google Scholar]
- 11.Moylan CA, et al. Hepatic gene expression profiles differentiate presymptomatic patients with mild versus severe nonalcoholic fatty liver disease. Hepatology. 2014;59:471–482. doi: 10.1002/hep.26661. [DOI] [PMC free article] [PubMed] [Google Scholar]
- 12.Murphy SK, et al. Relationship between methylome and transcriptome in patients with nonalcoholic fatty liver disease. Gastroenterology. 2013;145:1076–1087. doi: 10.1053/j.gastro.2013.07.047. [DOI] [PMC free article] [PubMed] [Google Scholar]
- 13.Feng A, Tu Z, Yin B. The effect of HMGB1 on the clinicopathological and prognostic features of non-small cell lung cancer. Oncotarget. 2016;7:20507–20519. doi: 10.18632/oncotarget.7050. [DOI] [PMC free article] [PubMed] [Google Scholar]
- 14.Li O, Zheng P, Liu Y. CD24 expression on T cells is required for optimal T cell proliferation in lymphopenic host. J. Exp. Med. 2004;200:1083–1089. doi: 10.1084/jem.20040779. [DOI] [PMC free article] [PubMed] [Google Scholar]
- 15.Deugnier MA, et al. Isolation of mouse mammary epithelial progenitor cells with basal characteristics from the Comma-Dbeta cell line. Dev. Biol. 2006;293:414–425. doi: 10.1016/j.ydbio.2006.02.007. [DOI] [PubMed] [Google Scholar]
- 16.Wang X, et al. NestinnegCD24low/- population from fetal nestin-EGFP transgenic mice enriches the pancreatic endocrine progenitor cells. Pancreas. 2005;31:385–391. doi: 10.1097/01.mpa.0000183376.96670.1e. [DOI] [PubMed] [Google Scholar]
- 17.Shakiba N, et al. CD24 Tracks Divergent Pluripotent States in Mouse and Human Cells. Nat Commun. 2015;6:7329. doi: 10.1038/ncomms8329. [DOI] [PMC free article] [PubMed] [Google Scholar]
- 18.Kim TS, Gorski SA, Hahn S, Murphy KM, Braciale TJ. Distinct Dendritic Cell Subsets Dictate the Fate Decision Between Effector and Memory CD8(+) T Cell Differentiation by a CD24-dependent Mechanism. Immunity. 2014;40:400–413. doi: 10.1016/j.immuni.2014.02.004. [DOI] [PMC free article] [PubMed] [Google Scholar]
- 19.Turcan S, et al. Mutant-IDH1-dependent Chromatin State Reprogramming, Reversibility, and Persistence. Nat Genet. 2018;50:62–72. doi: 10.1038/s41588-017-0001-z. [DOI] [PMC free article] [PubMed] [Google Scholar]
- 20.Lee JH, Kim SH, Lee ES, Kim YS. CD24 overexpression in cancer development and progression: a meta-analysis. Oncol. Rep. 2009;22:1149–1156. doi: 10.3892/or_00000548. [DOI] [PubMed] [Google Scholar]
- 21.Wang L, et al. Intracellular CD24 disrupts the ARF-NPM interaction and enables mutational and viral oncogene-mediated p53 inactivation. Nat. Commun. 2015;6:5909. doi: 10.1038/ncomms6909. [DOI] [PMC free article] [PubMed] [Google Scholar]
- 22.Wang X, et al. Long non-coding RNA DILC regulates liver cancer stem cells via IL-6/STAT3 axis. J. Hepatol. 2016;64:1283–1294. doi: 10.1016/j.jhep.2016.01.019. [DOI] [PubMed] [Google Scholar]
- 23.Rodeheffer MS, Birsoy K, Friedman JM. Identification of white adipocyte progenitor cells in vivo. Cell. 2008;135:240–249. doi: 10.1016/j.cell.2008.09.036. [DOI] [PubMed] [Google Scholar]
- 24.Smith NC, Fairbridge NA, Pallegar NK, Christian SL. Dynamic upregulation of CD24 in pre-adipocytes promotes adipogenesis. Adipocyte. 2015;4:89–100. doi: 10.4161/21623945.2014.985015. [DOI] [PMC free article] [PubMed] [Google Scholar]
- 25.Fairbridge NA, et al. Loss of CD24 in Mice Leads to Metabolic Dysfunctions and a Reduction in White Adipocyte Tissue. Plos One. 2015;10:e141966. doi: 10.1371/journal.pone.0141966. [DOI] [PMC free article] [PubMed] [Google Scholar]
- 26.Liu Q, Bengmark S, Qu S. The role of hepatic fat accumulation in pathogenesis of non-alcoholic fatty liver disease (NAFLD) Lipids Health Dis. 2010;9:42. doi: 10.1186/1476-511X-9-42. [DOI] [PMC free article] [PubMed] [Google Scholar]
- 27.Runz S, et al. CD24 induces localization of beta1 integrin to lipid raft domains. Biochem. Biophys. Res. Commun. 2008;365:35–41. doi: 10.1016/j.bbrc.2007.10.139. [DOI] [PubMed] [Google Scholar]
- 28.Wang XC, Zhan XR, Li XY, Yu JJ, Liu XM. Identification and validation co-differentially expressed genes with NAFLD and insulin resistance. Endocrine. 2015;48:143–151. doi: 10.1007/s12020-014-0247-5. [DOI] [PubMed] [Google Scholar]
- 29.Lambertz J, Berger T, Mak TW, van Helden J, Weiskirchen R. Lipocalin-2 in fructose-induced fatty liver disease. Front. Physiol. 2017;8:964. doi: 10.3389/fphys.2017.00964. [DOI] [PMC free article] [PubMed] [Google Scholar]
- 30.Nagarajan SR, et al. Insulin and diet-induced changes in the ubiquitin-modified proteome of rat liver. PLOS One. 2017;12:e0174431. doi: 10.1371/journal.pone.0174431. [DOI] [PMC free article] [PubMed] [Google Scholar]
- 31.Zhang X, et al. Overexpression of p53 improves blood glucose control in an insulin resistant diabetic mouse model. Pancreas. 2016;45:1010–1017. doi: 10.1097/MPA.0000000000000637. [DOI] [PubMed] [Google Scholar]
- 32.Adeva-Andany MM, López-Maside L, Donapetry-García C, Fernández-Fernández C, Sixto-Leal C. Enzymes involved in branched-chain amino acid metabolism in humans. Amino Acids. 2017;49:1005–1028. doi: 10.1007/s00726-017-2412-7. [DOI] [PubMed] [Google Scholar]
- 33.Wang H, et al. Biological Analysis of Cancer Specific microRNAs On Function Modeling in Osteosarcoma. Sci Rep. 2017;7:5382. doi: 10.1038/s41598-017-05819-7. [DOI] [PMC free article] [PubMed] [Google Scholar]
- 34.Tian, X. et al. Transcriptome Analysis Reveals the Molecular Mechanism of Hepatic Metabolism Disorder Caused by Chromium Poisoning in Chickens. Environ Sci Pollut Res Int. (2018). [DOI] [PubMed]
Associated Data
This section collects any data citations, data availability statements, or supplementary materials included in this article.


