Figure 2.
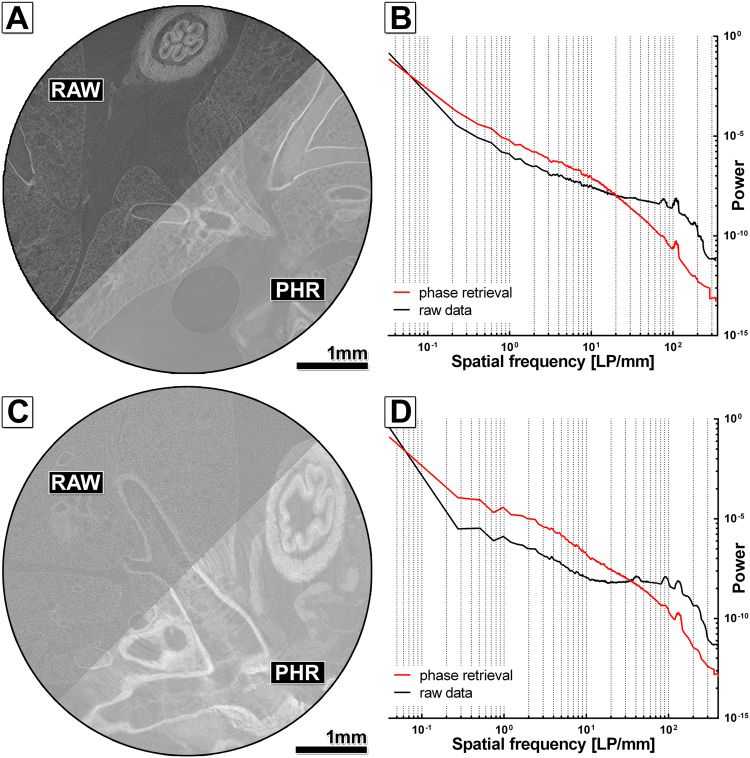
Free propagation phase contrast in high resolution microCT of phosphotungstic acid (PTA) stained paraffin or resin embedded mouse lungs. (A) Displays the comparison of the reconstruction based on RAW and PHR for the PTA stained and paraffin embedded mouse lung sample. An increased contrast and slightly lower noise level can be found in the PHR reconstruction. (B) Shows the radially averaged power spectra (raPS) for the images shown in (A). The PHR curve (red curve) shows higher intensities in the medium frequency range and lower intensities in the high frequency range. However, the difference is smaller than in (D) for the resin embedded sample. (C) Shows the comparison of the reconstructed raw data (RAW) and the phase retrieved (PHR) data (ANKA phase δ/β ratio 100) of a PTA stained mouse lung embedded in resin. A higher contrast and a lower noise level can be clearly seen in the phase retrieved data. (D) The raPS show a higher power in the medium frequency range and a lower power at the cut-off frequencies for the PHR data set (red curve) compared to the RAW data set (black curve), pointing to steeper edges and lower noise level.

