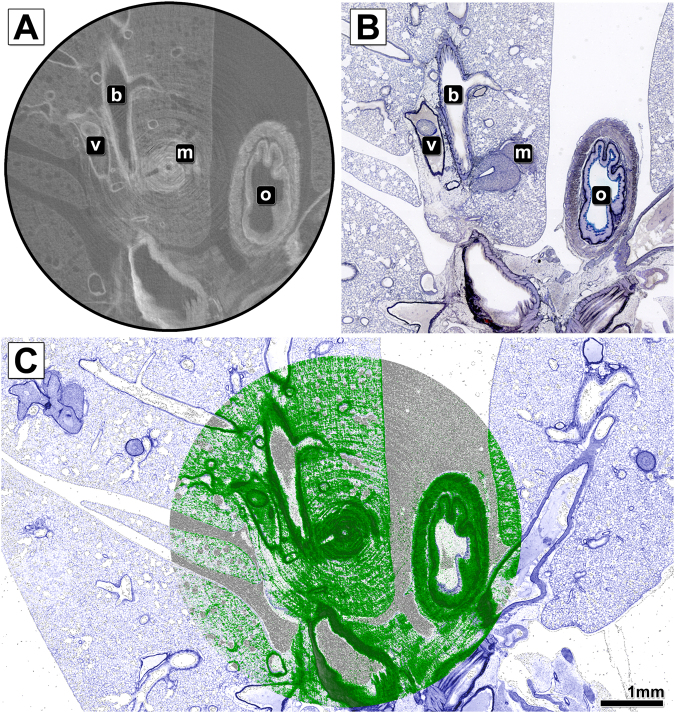
Figure 4.
Comparison and overlay of the microCT scan and histological image of the resin embedded and laser cut mouse lung sample. (A) Shows an exemplary slice of the reconstructed PHR microCT data set of the resin embedded PTA stained mouse lung. In addition to alveolar lung tissue, a lung metastasis (m), the oesophagus (o), larger bronchi (b) and blood vessels (v) are displayed. (B) Shows the microscope image of the Sandersons Rapid Stain (SRS) stained and van Gieson (VG) counterstained cut performed with the laser microtome at the predefined position. No cutting artefacts are visible. (C) Depicts the overlay of both data sets. The histological data is shown in pseudo SRS/VG colours (the data set was colourised for better visualisation), while the CT data is shown in green. The overlay of the CT data with the histology image reveals a precise match of both data sets.

