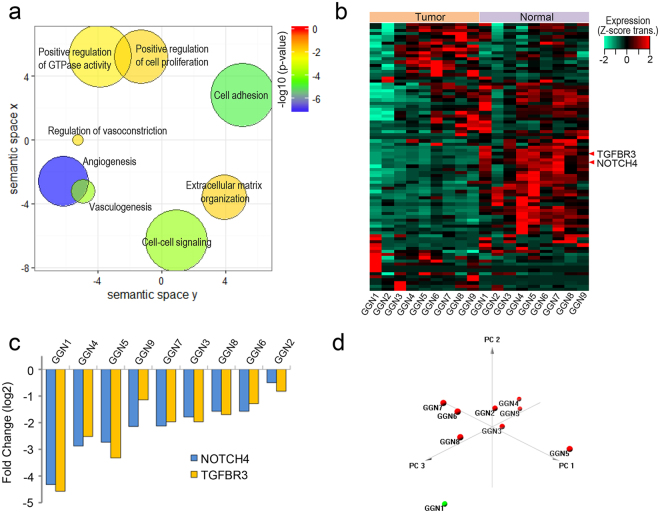
Figure 3.
Functional analysis of gene expression. (a) Semantic similarity-based scatter plots of enriched gene ontology terms with significantly altered genes, (b) heatmap of vasculogenesis-associated genes, (c) expression ratios of NOTCH4 and TGFBR3, and (d) principal component analysis of vasculogenesis-associated genes. (a) The downregulated genes were enriched for vasculogenesis (p = 1.27E−4). The more reddish color is the higher expression of a certain gene set. (b) Of the vasculogenesis-associated genes, NTOCH4 and TGFBR3 expression was significantly downregulated in adenocarcinoma tissue versus normal tissue (adjusted p < 0.001 for NOTCH4 and adjusted p < 0.001 for TGFBR3). (c) Notable downregulation of NOTCH4 and TGFBR3 was detected in GGN1. (d) Principal component analysis of vasculogenesis-associated genes showed that only GGN1 was an outlier. GGN, ground-glass nodule; NOTCH4, neurogenic locus notch homolog protein 4; TGFBR3, transforming growth factor beta receptor 3.

