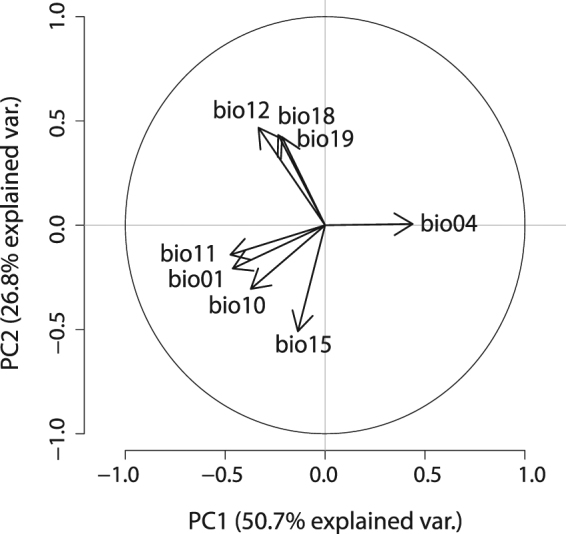
Figure 2.

Principle component analysis (PCA) plot. The contribution of the eight bioclimatic variables - Annual Mean Temperature (bio01), Temperature Seasonality (bio04), Mean Temperature of Warmest Quarter (bio10), Mean Temperature of Coldest Quarter (bio11), Annual Precipitation (bio12), Precipitation Seasonality (bio15), Precipitation of Warmest Quarter (bio18) and Precipitation of Coldest Quarter (bio19) - on the two PCA-axes PC1 and PC2 and the percentage of variability explained by these axes are shown in the PCA-plot.
