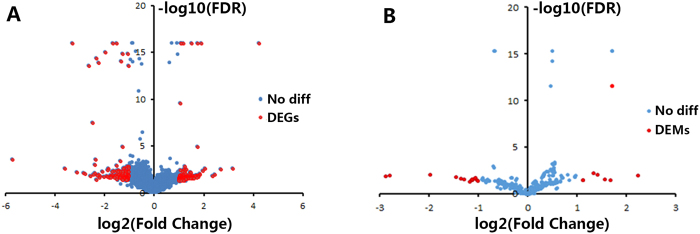
Figure 2.
Volcano plots of mRNAs and miRNAs. The plots were constructed by plotting −log10 (FDR) on the y-axis and log2 (fold change) on the x-axis. DEGs, differentially expressed mRNAs; DEMs, differentially expressed miRNAs. (A) Volcano plots of mRNAs; red blots represent differentially expressed mRNAs, and blue blots represent mRNAs with no significant difference. (B) Volcano plots of miRNAs; red blots represent differentially expressed miRNAs, and blue blots represent miRNAs with no significant difference.

