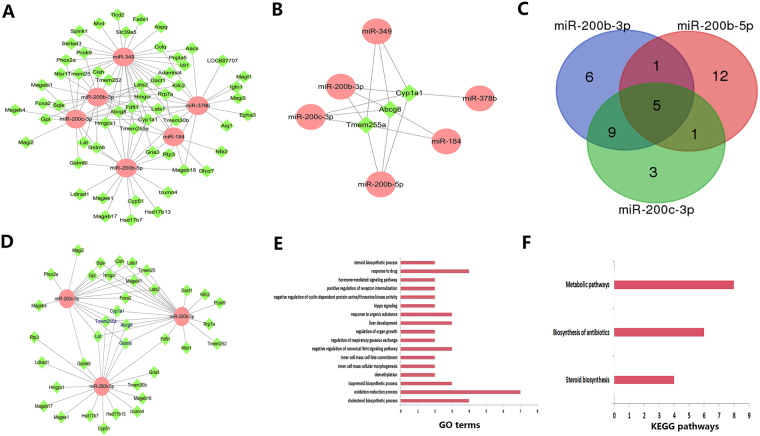
Figure 6.
Up-regulated miRNA vs. down-regulated mRNA pairs. (A) 114 up-regulated miRNA vs. down-regulated mRNA pair regulatory networks with 6 miRNAs and their targets. Ellipse nodes represent miRNAs, and diamond nodes represent mRNAs; up-regulated and down-regulated miRNAs are shown in red and green, respectively. (B) A sub-network of Abcg8, Cyp1a1 and Tmem255a, each connected to 5 different miRNAs. (C) Venn diagram of miR-200b-3p, miR-200b-5p and miR-200c-3p. (D) A sub-network of miR-200b-3p, miR-200b-5p and miR-200c-3p and their target genes. The blue label represents the intersection target genes of the three miRNAs. (E) GO analysis of miR-200b-3p, miR-200b-5p and miR-200c-3p target genes; the x-axis represents gene counts, and the y-axis represents GO terms. (F) KEGG pathway analysis of miR-200b-3p, miR-200b-5p and miR-200c-3p target genes; the x-axis represents gene counts, and the y-axis represents KEGG pathway names.

