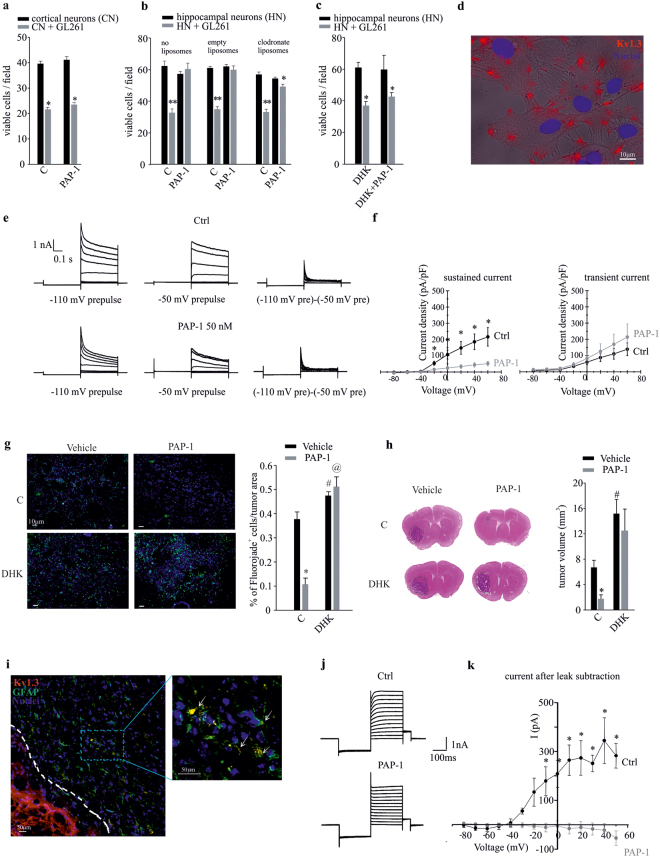
Figure 1.
The inhibition of Kv1.3 channels induces neuroprotection against the toxic effects of glioma. (a) Cortical neurons (CN) co-cultured with GL261 cells (grey bars) or alone (black bars) were treated with PAP-1 (50 nM, 18 h) or vehicle (C) and analyzed for neuronal viability. Results are expressed as number of viable cells/field. *p = 0.001 vs C; n = 4, unpaired t-test. (b) Hippocampal neurons (HN) pre-treated or not with empty or clodronate-filled liposomes for 24 h, co-cultured as in (a) for a further 18 h in presence of PAP-1 (50 nM) or vehicle (C), were analyzed for neuronal viability. Results are expressed as number of viable cells/field. **p = 0.001 and *p < 0.05 vs C; n = 4, Holm-Sidak One Way ANOVA. (c) Hippocampal neurons (HN) co-cultured as in (a) were treated with PAP-1 or vehicle in the absence or presence of DHK (DHK + PAP-1) and were analyzed for neuronal viability. Results are expressed as number of viable cells/field. *p = 0.001 vs C; n = 4, Kruskal-Wallis One Way ANOVA. (d) Primary astrocytes were assayed by immunofluorescence for the membrane expression of Kv1.3 channels (red, Hoechst in blue) merged with bright field. (e) Representative families of current traces obtained in cultured astrocytes by applying voltage steps from −80 to +60 mV (delta = 20 mV) from a holding potential of −80 mV, preceded by a 400 ms prepulse at either −110 mV (left) or −50 mV (middle), under control conditions (black) and following bath application of 50 nM PAP-1 (grey). The current traces to the right were obtained by point-by-point subtraction of the currents recorded with the two different prepulses. (f) Mean current-voltage relationships obtained by applying the same voltage protocols described in (e) to 7 different astrocytes. The sustained current was taken from the end of the depolarizing pulses in the current traces obtained with the prepulse voltage of −50 mV. The transient current is the peak of the current traces obtained by point-by-point subtraction. *p < 0.001, paired t-test. (g) Neuronal death, measured as Fluoro-Jade staining (green; Hoechst in blue) in coronal brain slices of GL261-bearing mice, treated with vehicle or PAP-1 (40 mg/kg/die), in the absence or presence of DHK (10 mg/kg/die); right, immunofluorescence quantification expressed as % of Fluoro-Jade+ cell area normalized for tumor area, n = 3, *p = 0.001, #p = 0.017, @p = 0.005 vs Vehicle, Student-Newman-Keuls One Way ANOVA. (h) Tumor volumes in the brain of mice treated as in (g),with or without DHK (10 mg/kg/die). Right, mean of tumor volumes (in mm3) ± s.e.m., n = 8, *p = 0.013, #p = 0.018 vs Vehicle, Kruskal-Wallis One Way ANOVA. (i) Immunofluorescence analyses of Kv1.3 expression (red) on GFAP-positive cells (green) in coronal brain slices of GL261-bearing mice in peritumoral region; in the magnification (right) arrows indicate co-expression of Kv1.3 and GFAP in the same cell. (j) Representative current traces obtained by whole-cell patch-clamp recordings from peritumoral astrocytes in GL261-bearing mice. Voltage steps were applied as in (e) with a −110 mV prepulse, under control conditions (Ctrl) and following bath application of 100 nM PAP-1. (k) Mean current-voltage relationships were determined subtracting the steady-state current from the peak current at each voltage step, before (Ctrl, in black) and after PAP-1 application (in grey). The resulting current (I) was expressed in pA. PAP-1 treatment abolished the voltage-activated current observed in Ctrl condition, n = 4, *p < 0.05, paired t-test.

