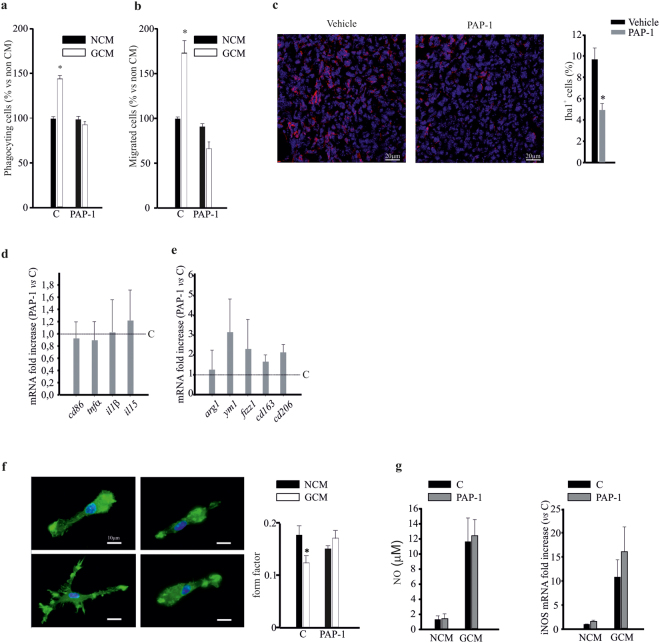
Figure 4.
Kv1.3 activity modulates microglia functions. (a–b) Non-conditioned medium (NCM)- and glioma conditioned medium (GCM)-treated microglia, in the absence (C) or presence of PAP-1 (50 nM) assayed for phagocytosis (a) and migration (b). Data are expressed as the % of phagocytosing (a) and migrated (b) cells ± s.e.m. *p = 0.001vs NCM; n = 4, Kruskal-Wallis One Way ANOVA on Ranks. (c) Coronal brain sections of GL261-bearing mice treated with PAP-1 (40 mg/kg/die) or vehicle were stained for Iba1 (red) and Hoechst (blue), scale bar 20 µm. On the right, % of Iba1+ cell area normalized for tumor area, *p = 0.002, unpaired t-test, n = 6. (d,e) RT-PCR for pro- (cd86, tnfα, il1α, il15) and anti- (arg1, ym1, cd163, cd206) inflammatory genes expressed by CD11b+ cells extracted from ipsilateral hemisphere of brains of GL261-bearing mice treated with vehicle (C) or PAP-1 (40 mg/kg/die). Data are expressed as fold change of PAP-1-treated vs vehicle-treated samples (C, dashed lines) and are the mean ± s.e.m., *p < 0.05 by Student’s t-test; n = 4. (f) NCM- and GCM-treated microglia in the absence (C) or presence of PAP-1 (50 nM), stained with phalloidin (green) and Hoechst (blue), scale bar: 20 μm. Form factor values (calculated as reported in the Methods section) are shown in the graph (right) and are the mean ± s.e.m. of n = 4, *p = 0.001; Kruskal-Wallis One Way ANOVA. (g) NCM- and GCM-treated microglia in the absence (C) or presence of PAP-1 (50 nM) were assayed for NO production (expressed in µM) and iNOS mRNA expression (expressed as fold increase), n = 4, there is not a statistically significant difference between C and PAP-1 groups both on NCM and GCM conditions (p = 0.082 for NO production; p = 0.088 for iNos mRNA expression).

