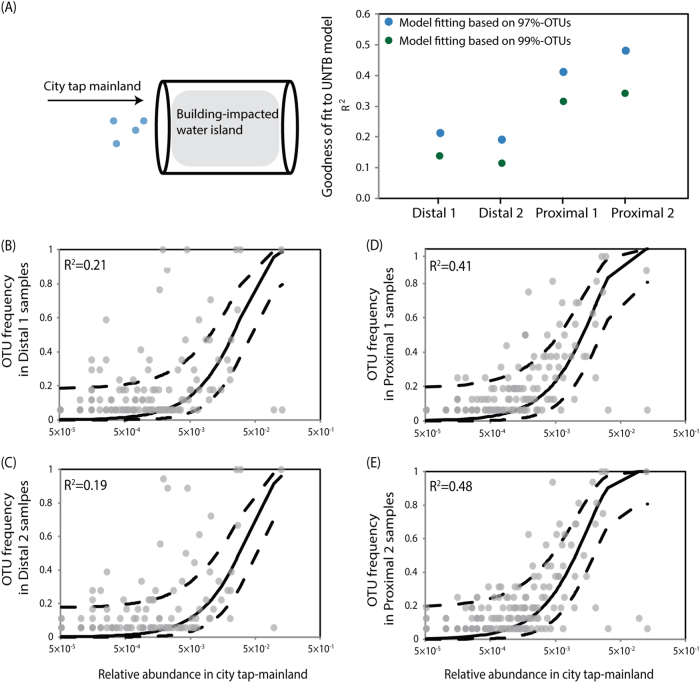
Fig. 5.
Modeling the role of city water supply to building-impacted water. Results of neutral model fitting shows an increase in the deviation from city water supplies as water approaches the faucets, in both OTUs defined at 97 and 99% sequence similarity (a). b–e Fitting of neutral processes (i.e., migration and demographic stochasticity) from city water supply to the building tap water islands in the flow segments of first 100 mL (b), 200–1000 mL (c), 1100–2000 mL (d), and 2100–3000 mL (e)

