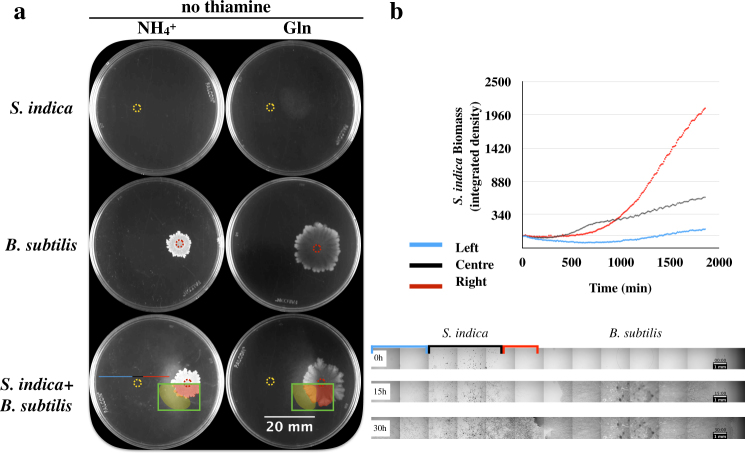
Fig. 4.
Serendipita indica and B. subtilis interactions on agar plates. a Rows from top to bottom show growth of monocultures of S. indica, B. subtilis, and their co-culture, respectively, under the absence of thiamine. The yellow dotted circle on the images indicates the S. indica inoculation point. Red dotted circle indicates B. subtilis inoculation point. The left and right columns show growth on plates after 2 weeks, using ammonium and glutamine as nitrogen sources, respectively. Green square highlights the colonies with pseudo-color, where the area covered by S. indica hyphae is shown in yellow, and the B. subtilis colony is shown in red. The areas were manually drawn. When both organisms were cultured together (bottom row), B. subtilis and S. indica were inoculated on the right and left of the plate, respectively. Plates shown are representative of at least three replicates for each condition. We performed two biological replicates of this experiment, with qualitatively similar results. b, Top: S. indica biomass obtained from the defined horizontal sections of the plate of S. indica and B. subtilis co-culture on thiamine-free medium (the bottom left plate shown in the third row of part a). Biomass was calculated by integrated density of each horizontal sections based on image analysis. The blue, black, and red lines correspond to the horizontal sections as shown on the plate and in the time-lapse image series of S. indica and B. subtilis growth on agar plates as below. Bottom: The microscopy images are from the middle cross-section of the plate through the inoculation point of S. indica and B. subtilis, at 0, 15, and 30 h after inoculation. The red, black, and blue highlighted sections correspond to the S. indica colony side closer to B. subtilis, the middle of the colony, and the colony side far from B. subtilis, respectively

