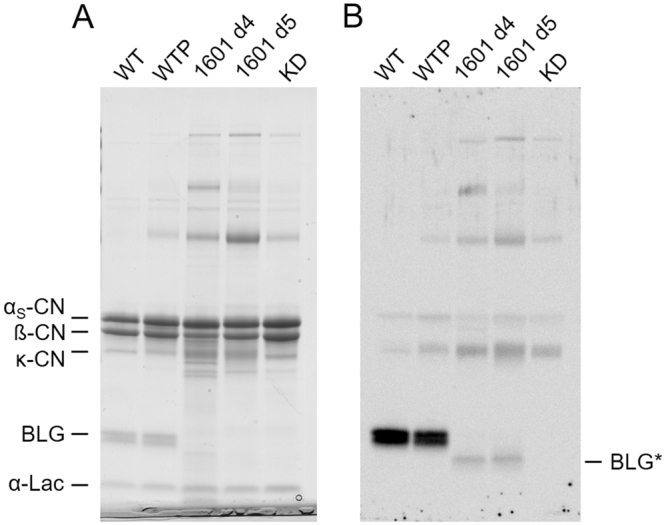
Figure 5.

Amount of BLG in induced milk of the genome edited LGB knockout calf 1601. BLG levels in the milk of calf 1601 were assessed by (A) Coomassie Blue staining and (B) western analysis following SDS-PAGE separation of milk samples. Each lane of the gel was loaded with an equal amount of milk. WT: natural milk from a single wild type cow; WTP: pooled natural milk samples from several wild type cows; 1601 d4 and d5: milk sample from 1601 on the fourth and fifth day of an induced lactation; KD: milk sample from a transgenic line of LGB knockdown cattle. Positions of the main milk proteins and a smaller form of BLG (BLG*) observed by western are indicated. αs-CN: αs-casein; β-CN: β-casein; κ-CN: κ-casein; BLG: β-lactoglobulin; α-Lac: α-lactalbumin. Please note, the images shown in panels A and B were cropped for improved clarity. The respective full size photos of the stained gel and western membrane are shown in Supplementary Figure S4.
