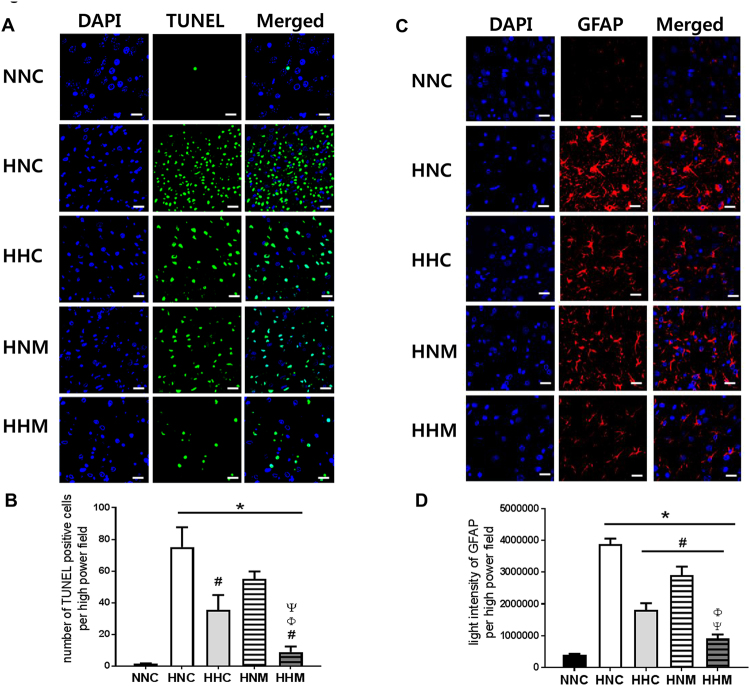
Figure 3.
Representative immunofluorescence micrographs of the penumbra area with staining for terminal deoxynucleotidyl transferase nick end labeling (TUNEL) (A), glial fibrillary acidic protein (GFAP) (C), and DAPI (original magnification; x400, scale bars; 25 μm). Average number of TUNEL-positive cells (B) and average innsity of GFAP staining (D) in the penumbra area. Data are mean ± SEM. HNC, HIE + normothermia control; HHC, HIE + hypothermia; HNM, HIE + normothermia + MSCs; HHM, HIE + hypothermia + MSCs. *P < 0.05 vs. NNC, #P < 0.05 vs. HNC, ΦP < 0.05 vs. HHC, ΨP < 0.05 vs. HNM.

