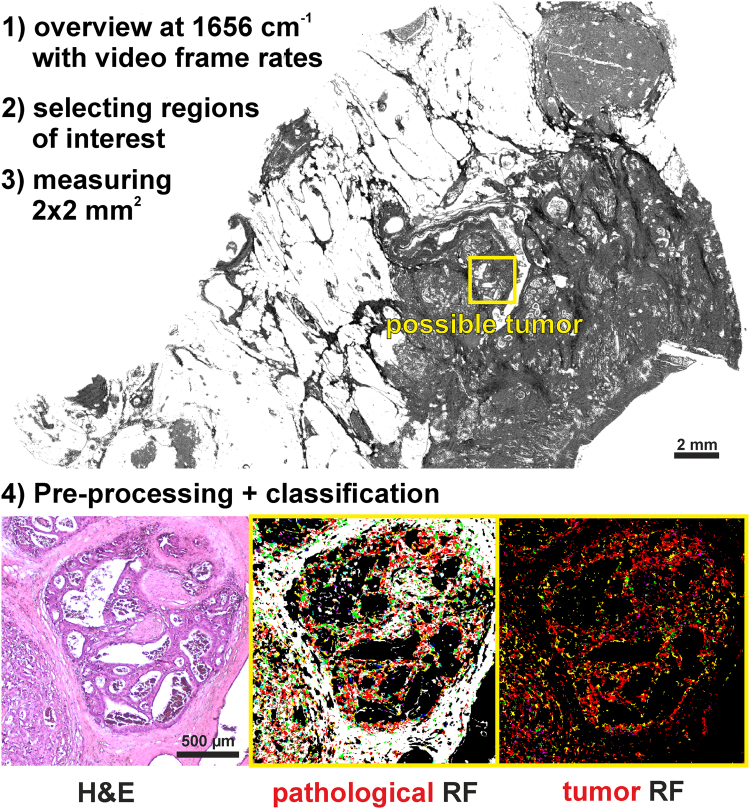
Figure 4.
Suggested diagnostic workflow. The overview image was taken at amid I (1656 cm−1), showing tissue morphological characteristics. Upper right, a large lymph follicle; center, glandular tumor lesion; yellow rectangle, region of interest. Bottom, single field analyses. Left, H&E staining; middle, first-level RF analysis; red, pathological regions; yellow, the invading inflammatory cells; white, the surrounding muscles; green, connective tissue. Right, second level RF analysis. All regions marked red using the first level RF were further analyzed by the second level RF of the selected, single-field, region: red, tumor cells; magenta, necrotic regions; yellow, infiltrating inflammatory cells.

