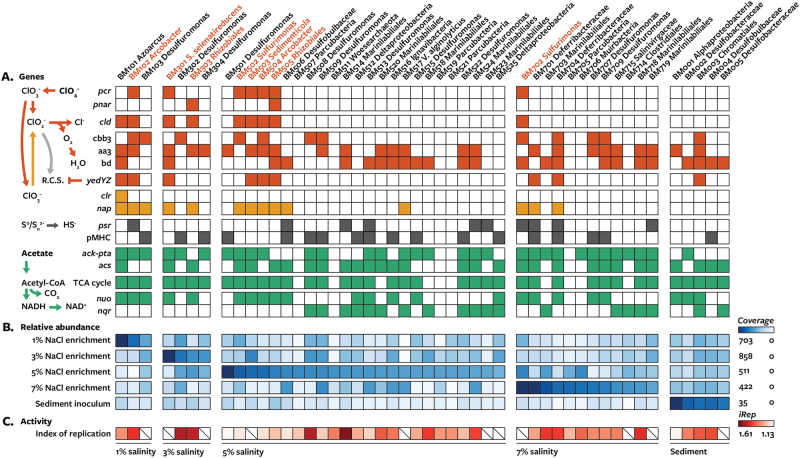
Fig. 1.
Summary of energy metabolism genes, abundance, and activity of metagenome-assembled genomes from perchlorate-reducing enrichments (1, 3, 5, and 7% salinity) and sediment inoculum. Genomes predicted to be dissimilatory perchlorate-reducing bacteria are shown in red. a Gene content based on presence (filled squares) or absence (empty squares) of key genes involved different metabolisms. Genes in the same vertical division perform the same function. Gene abbreviations: pcr perchlorate reductase, pnar periplasmic Nar nitrate reductase, cld chlorite dismutase, yedYZ periplasmic methionine sulfoxide reductase, clr chlorate reductase, nap periplasmic nitrate reductase, cbb3 cbb3-type cytochrome c oxidase, aa3 aa3-type cytochrome c oxidase or cytochrome bo(3) ubiquinol oxidase, bd cytochrome bd quinol oxidase, psr polysulfide reductase, pMHC periplasmic multi-heme cytochrome c, ack-pta acetate kinase and phosphotransacetylase, acs acetyl-CoA synthase, nqo proton-translocating NADH:quinol oxidoreductase, nqr sodium-translocating NADH:quinol oxidoreductase. b Relative abundance of metagenome-assembled genomes within samples (coverage/coverage of most abundant community member). c Relative activity across samples as measured by index of replication (iRep). Slash indicates the iRep value could not be determined

