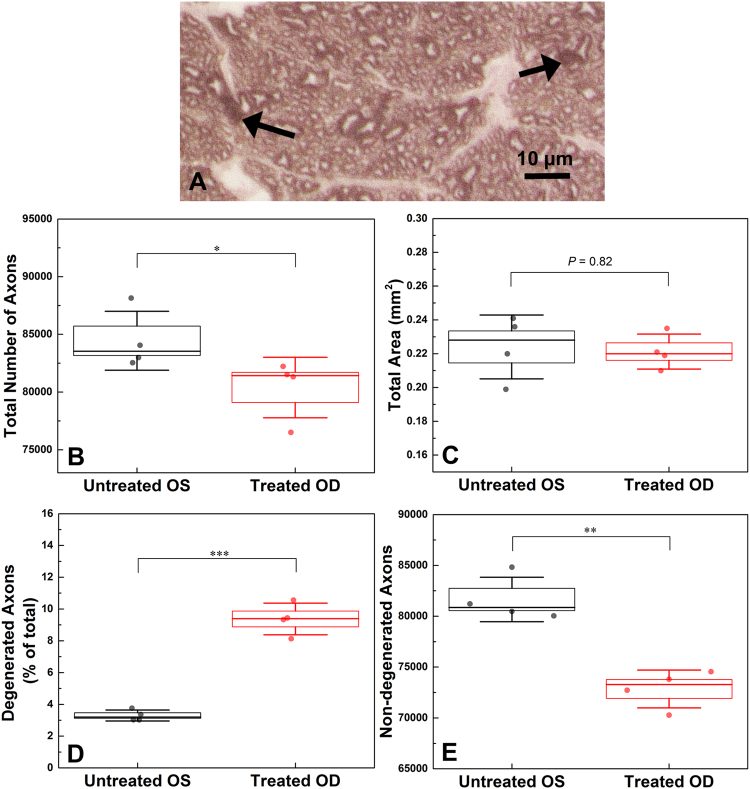
Figure 7.
Histological image of an optic nerve axonal cross-sectional sample, obtained from a treated eye of one rat. Arrows: degenerative profile examples, scale bar = 10 µm (A). Boxplots for the total number of axons (B), the total axonal area (C), the percentage of degenerated axons (D) and the total number of non-degenerated axons (E). In each boxplot, line represents median, box represents SE and whiskers represent SD. *p < 0.05, **p < 0.05, ***p < 0.001.

