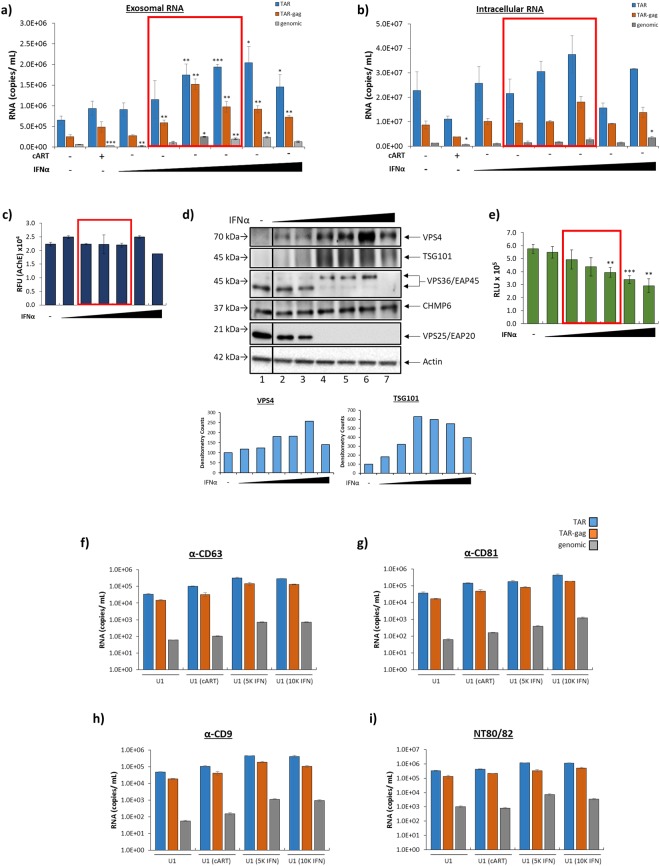
Figure 8.
IFNα-2a increases packaging of HIV-1 viral RNA into EVs. U1 cells were treated with a titration of IFNα-2a (0.5 K, 1 K, 5 K, 10 K, 50 K, and 100 K units) for 5 days. (a) EVs were enriched using NT80/82 particles and analyzed for the presence of TAR, TAR-gag, and genomic RNA using RT-qPCR (see Methods). (b) The cells responsible for the production of EVs analyzed in panel a were analyzed for the levels of intracellular viral RNA using RT-qPCR. (c) AChE activity was measured (relative fluorescent units; RFU) in isolated EVs released from U1 cells that were treated with IFNα-2a and U1 controls. (d) U1 cells were treated with a titration of IFNα-2a (0.5K-100K units) for 5 days. Whole cell extracts were analyzed by Western blot for ESCRT pathway proteins [ESCRT-I (TSG101),-II (EAP20, EAP45),-III (CHMP6), and exit (VPS4)] and Actin protein levels. Selected lanes were taken from the same blot with identical exposure settings presented in the figure. Densitometry counts as determined by ImageJ software is shown as increase or decrease of VPS4 or TSG101 relative to the untreated control (set to 100%). (e) IFNα-2a-treated cells were assessed for cell viability using CellTiter-Glo reagent. (f–i) U1 cells were treated with cART (45 µM) or IFNα-2a (5 K or 10 K) for 5 days. EVs were enriched from supernatants using immunoprecipitation with EV marker antibodies (CD81, CD9, CD63) or NT80/82 particles. Resulting samples were analyzed by RT-qPCR for TAR, TAR-gag, and genomic RNA (see Methods). Red boxes highlight clinically relevant IFN concentrations. Error bars represent ± S.D. of three technical replicates for all panels. A two-tailed Student’s t-test was used to assess significance: *p < 0.05; **p < 0.01; ***p < 0.001.

