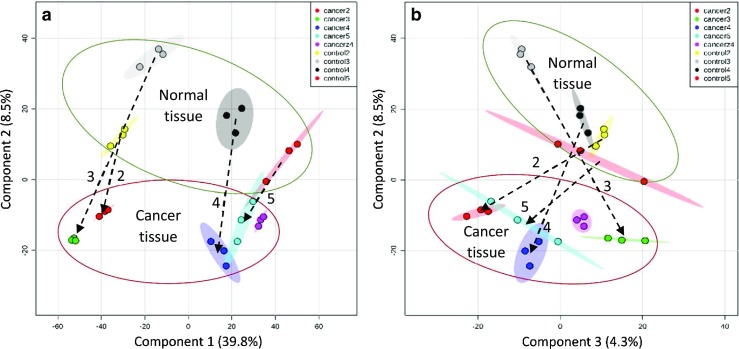
Fig. 1.

PLS-DA plot based on LC-MS data processed in Metaboanalyst 3.0, showing a component 2 versus component 1 and b component 2 versus component 3. For each patient, an arrow starts at the location of the normal tissue and ends at the location of the respective cancer tissue. Sample “cancerz4” is based on an inferior vena cava tumor thrombus tissue
